AGUAS_EMENDADAS


Location

lon / lat [deg]: -47.6563 / -15.5818

Source network: AERONET


Geostationary surface albedo (GSA) data


“+000”


“+057/+063”


Landcover information (based on ESA CCI landcover data)


Landcover fractions @ 2km distance


Landcover fractions @ 20 km distance


Legend


Distance to open water bodies [km]:

3.35

Distance to urban areas [km]:

1.37


Radius: 1 km

Number of landcover classes:

2

Dominant landcover type:

120: Shrubland

Fraction of dominant landcover type [%]:

88.0


Radius: 2 km

Number of landcover classes:

5

Dominant landcover type:

120: Shrubland

Fraction of dominant landcover type [%]:

74.0


Radius: 5 km

Number of landcover classes:

6

Dominant landcover type:

120: Shrubland

Fraction of dominant landcover type [%]:

33.0


Radius: 10 km

Number of landcover classes:

7

Dominant landcover type:

10: cropland, rainfed

Fraction of dominant landcover type [%]:

45.0


Radius: 20 km

Number of landcover classes:

8

Dominant landcover type:

10: cropland, rainfed

Fraction of dominant landcover type [%]:

54.0


Disturbances


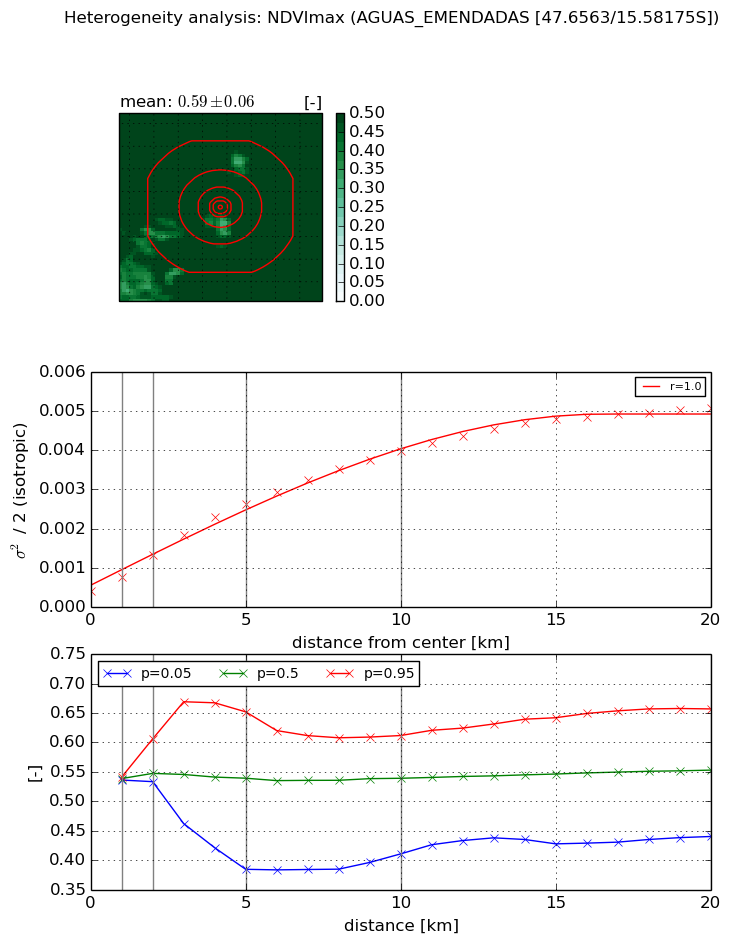
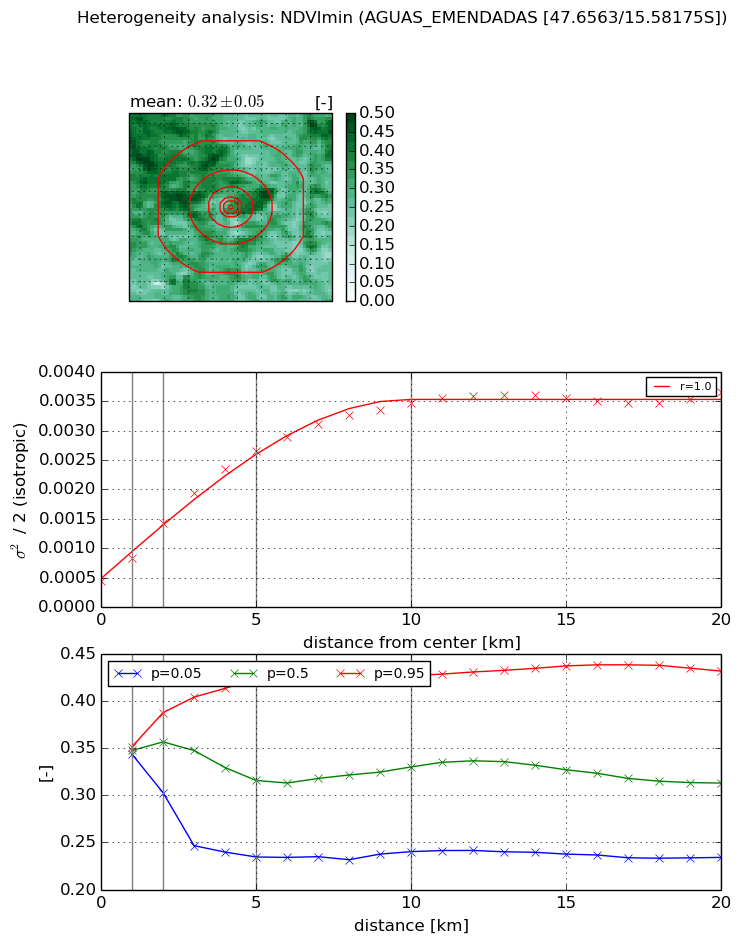
Heterogeneity analysis

The heterogeneity analysis provides information about the spatial and temporal heterogeneity of the site.

Topography


Roman et al. (2009) index


St

1.36954293977

Rcv

0.210302722711

Rse

0.0

Rst

1.919649358e-06

Rsv

1.98020717942


Height range @ 1km [m]

54

Height range @ 2km [m]

71

Height range @ 5km [m]

100

Height range @ 10km [m]

-999

Height range @ 20km [m]

-999


Variance slope @ 1 km

173

Variance slope @ 2 km

202

Variance slope @ 5 km

208

Variance slope @ 10 km

-999

Variance slope @ 20 km

-999


NDVI (max. NDVI composite)


Roman et al. (2009) index


St

4.03978680411

Rcv

0.446155996436

Rse

0.0

Rst

0.0118299004891

Rsv

0.284627549147


NDVI range @ 1km [-]

0.01

NDVI range @ 2km [-]

0.07

NDVI range @ 5km [-]

0.27

NDVI range @ 10km [-]

0.2

NDVI range @ 20km [-]

0.22


Variance slope @ 1 km

0.000351053092159

Variance slope @ 2 km

0.000464780126707

Variance slope @ 5 km

0.000463398843246

Variance slope @ 10 km

0.000361185683908

Variance slope @ 20 km

0.000226816998295


NDVI (min. NDVI composite)I


Roman et al. (2009) index


St

2.45319142198e-07

Rcv

0.218281720521

Rse

0.0

Rst

0.157377137848

Rsv

12228967.8701


NDVI range @ 1km [-]

0.01

NDVI range @ 2km [-]

0.09

NDVI range @ 5km [-]

0.19

NDVI range @ 10km [-]

0.19

NDVI range @ 20km [-]

0.2


NDVI slope @ 1 km

0.00038346019756

NDVI slope @ 2 km

0.000493047988175

NDVI slope @ 5 km

0.000458732180524

NDVI slope @ 10 km

0.000305146982993

NDVI slope @ 20 km

0.000129864756906


Temporal stability analysis

+000 deg (BHR)


BHR statistics

Temporal stability [1/decade]:


abs

rel


Weighted least square:

-99999.0


Ordinary least square:

-99999.0


Probabilities that GCOS criteria is met:

Weighted least square:

-99999.0 %

Ordinary least square:

-99999.0 %


DHR statistics

Temporal stability [1/decade]:


abs

rel


Weighted least square:

-99999.0


Ordinary least square:

-99999.0


Probabilities that GCOS criteria is met:

Weighted least square:

-99999.0 %

Ordinary least square:

-99999.0 %


+057/+063 deg (BHR)


BHR statistics

Temporal stability [1/decade]:


abs

rel


Weighted least square:

None


Ordinary least square:

None


Probabilities that GCOS criteria is met:

Weighted least square:

None %

Ordinary least square:

None %


DHR statistics

Temporal stability [1/decade]:


abs

rel


Weighted least square:

None


Ordinary least square:

None


Probabilities that GCOS criteria is met:

Weighted least square:

None %

Ordinary least square:

None %


Temporal anomaly analyis

The variance of the temporal anomalies provides an additional measure about the stability of the signal AFTER removal of the mean seasonal cylce.

+000 deg


+057/+063 deg