AL_KHAZNAH


Location

lon / lat [deg]: 55.1006 / 24.1586

Source network: AERONET


Geostationary surface albedo (GSA) data


“+000”


“+057/+063”


Landcover information (based on ESA CCI landcover data)


Landcover fractions @ 2km distance


Landcover fractions @ 20 km distance


Legend


Distance to open water bodies [km]:

44.76

Distance to urban areas [km]:

38.43


Radius: 1 km

Number of landcover classes:

3

Dominant landcover type:

150: Sparse vegetation (tree, shrub, herbaceous cover) (<15%)

Fraction of dominant landcover type [%]:

57.0


Radius: 2 km

Number of landcover classes:

4

Dominant landcover type:

200: bare areas

Fraction of dominant landcover type [%]:

50.0


Radius: 5 km

Number of landcover classes:

4

Dominant landcover type:

200: bare areas

Fraction of dominant landcover type [%]:

76.0


Radius: 10 km

Number of landcover classes:

3

Dominant landcover type:

200: bare areas

Fraction of dominant landcover type [%]:

89.0


Radius: 20 km

Number of landcover classes:

3

Dominant landcover type:

200: bare areas

Fraction of dominant landcover type [%]:

94.0


Disturbances


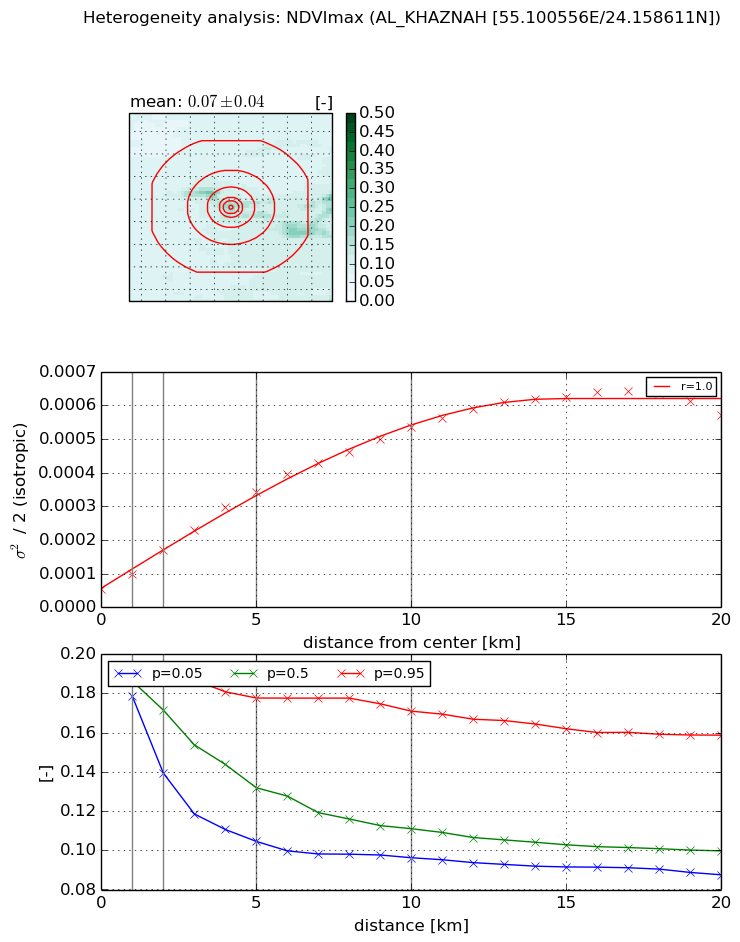
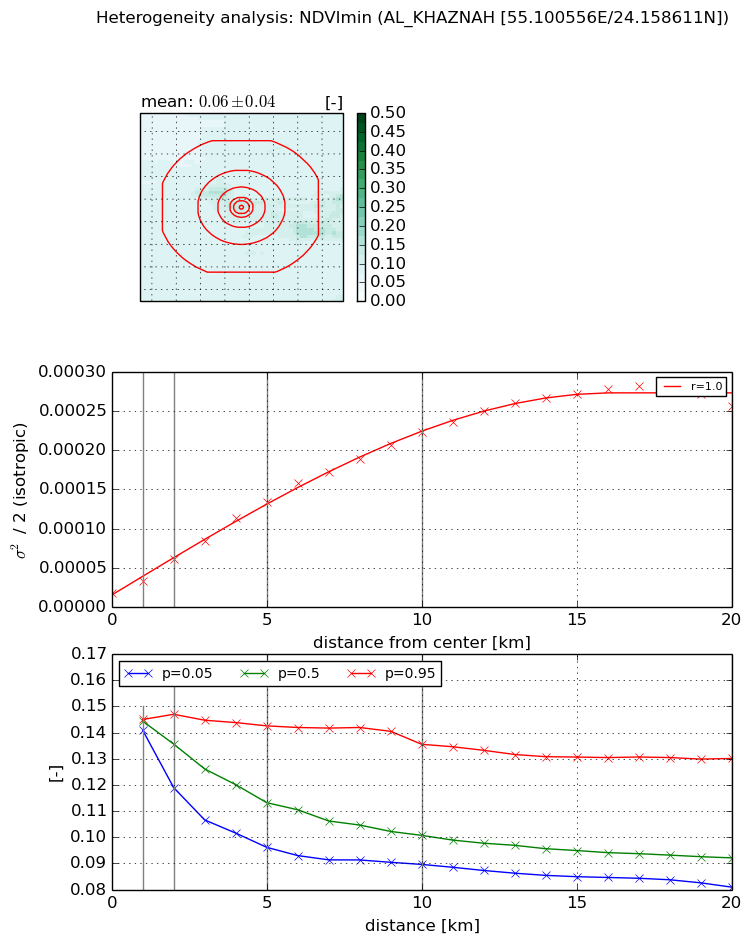
Heterogeneity analysis

The heterogeneity analysis provides information about the spatial and temporal heterogeneity of the site.

Topography


Roman et al. (2009) index


St

4.7289645564

Rcv

0.0194018019129

Rse

0.0

Rst

-0.135583776052

Rsv

0.479402767352


Height range @ 1km [m]

33

Height range @ 2km [m]

32

Height range @ 5km [m]

32

Height range @ 10km [m]

-999

Height range @ 20km [m]

-999


Variance slope @ 1 km

48

Variance slope @ 2 km

33

Variance slope @ 5 km

13

Variance slope @ 10 km

-999

Variance slope @ 20 km

-999


NDVI (max. NDVI composite)


Roman et al. (2009) index


St

5.26149960293

Rcv

0.239820004819

Rse

0.0

Rst

-0.0249055217466

Rsv

0.30545412304


NDVI range @ 1km [-]

0.01

NDVI range @ 2km [-]

0.05

NDVI range @ 5km [-]

0.07

NDVI range @ 10km [-]

0.07

NDVI range @ 20km [-]

0.07


Variance slope @ 1 km

4.48158370865e-05

Variance slope @ 2 km

5.93781615796e-05

Variance slope @ 5 km

6.00292696794e-05

Variance slope @ 10 km

4.91353519941e-05

Variance slope @ 20 km

2.81743959661e-05


NDVI (min. NDVI composite)I


Roman et al. (2009) index


St

5.88342657377

Rcv

0.228266882447

Rse

0.0

Rst

-9.15604232888e-05

Rsv

0.28154849017


NDVI range @ 1km [-]

0.0

NDVI range @ 2km [-]

0.03

NDVI range @ 5km [-]

0.05

NDVI range @ 10km [-]

0.05

NDVI range @ 20km [-]

0.05


NDVI slope @ 1 km

1.60406476076e-05

NDVI slope @ 2 km

2.17444844419e-05

NDVI slope @ 5 km

2.40401175739e-05

NDVI slope @ 10 km

2.11371949922e-05

NDVI slope @ 20 km

1.32047947206e-05


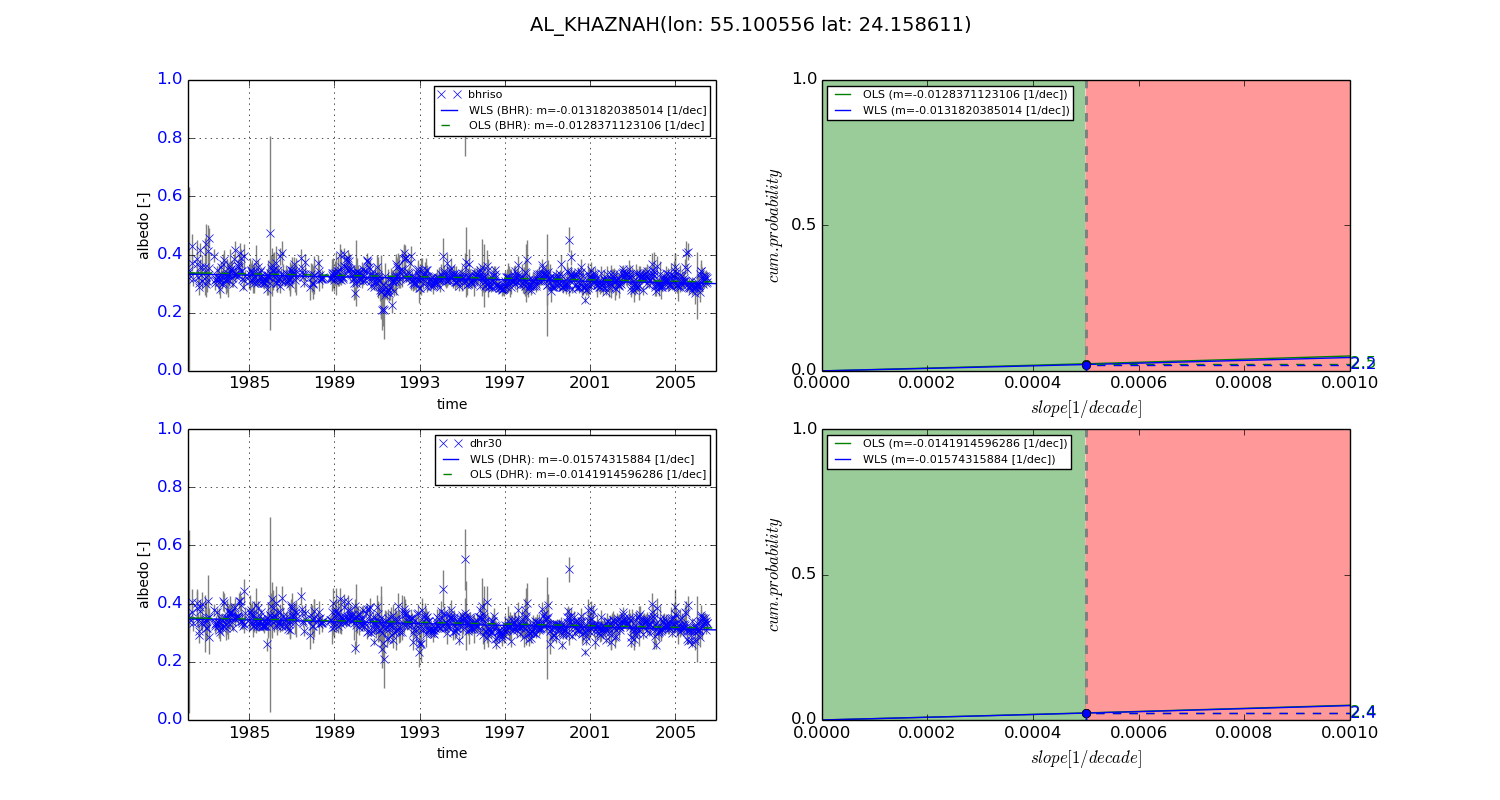
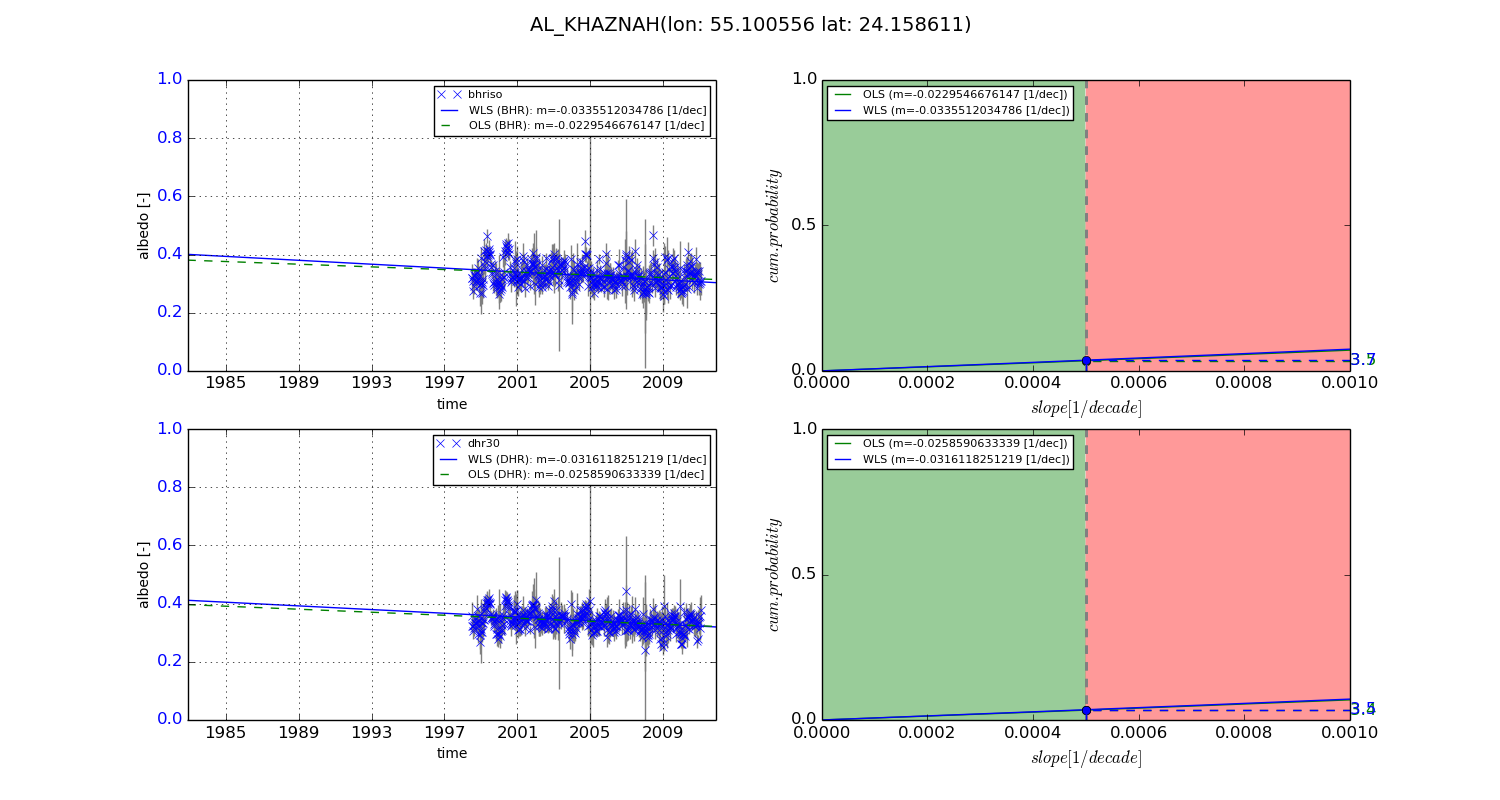
Temporal stability analysis

+000 deg (BHR)


BHR statistics

Temporal stability [1/decade]:


abs

rel


Weighted least square:

-0.0131820385014


Ordinary least square:

-0.0128371123106


Probabilities that GCOS criteria is met:

Weighted least square:

2.2 %

Ordinary least square:

2.5 %


DHR statistics

Temporal stability [1/decade]:


abs

rel


Weighted least square:

-0.01574315884


Ordinary least square:

-0.0141914596286


Probabilities that GCOS criteria is met:

Weighted least square:

2.4 %

Ordinary least square:

2.4 %


+057/+063 deg (BHR)


BHR statistics

Temporal stability [1/decade]:


abs

rel


Weighted least square:

-0.0335512034786


Ordinary least square:

-0.0229546676147


Probabilities that GCOS criteria is met:

Weighted least square:

3.7 %

Ordinary least square:

3.5 %


DHR statistics

Temporal stability [1/decade]:


abs

rel


Weighted least square:

-0.0316118251219


Ordinary least square:

-0.0258590633339


Probabilities that GCOS criteria is met:

Weighted least square:

3.5 %

Ordinary least square:

3.4 %


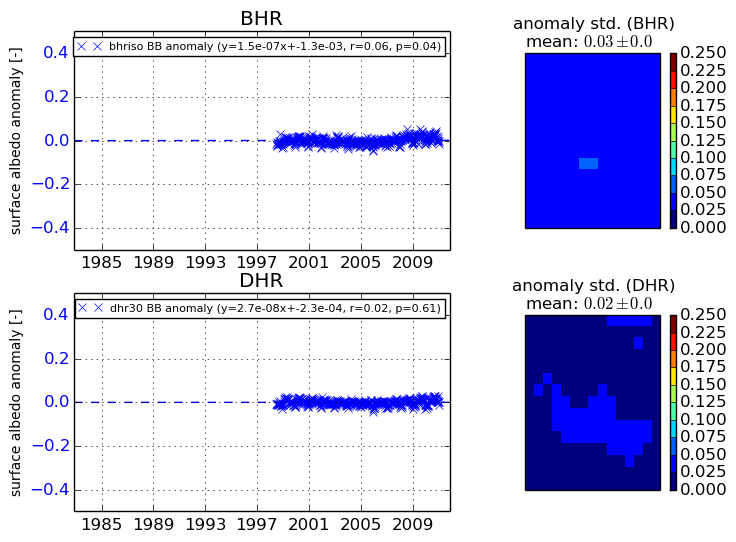
Temporal anomaly analyis

The variance of the temporal anomalies provides an additional measure about the stability of the signal AFTER removal of the mean seasonal cylce.
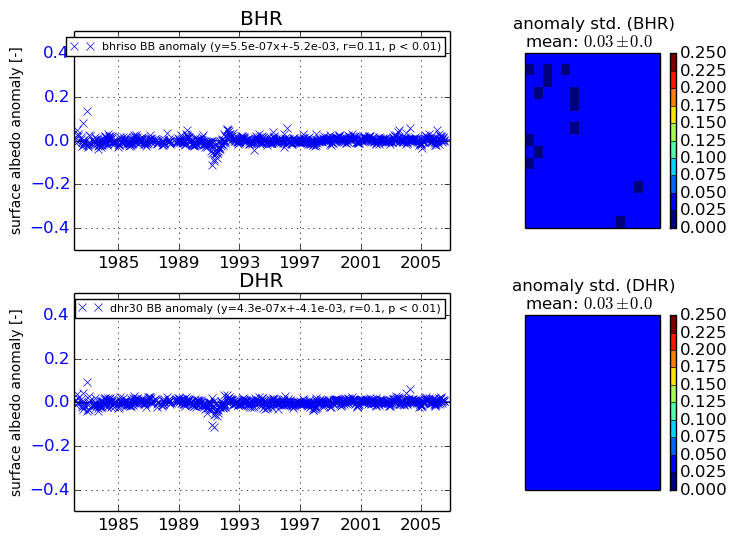
+000 deg


+057/+063 deg