ANGIOLA


Location

lon / lat [deg]: -119.538 / 35.947

Source network: AERONET


Geostationary surface albedo (GSA) data


“+000”


“+057/+063”


Landcover information (based on ESA CCI landcover data)


Landcover fractions @ 2km distance


Landcover fractions @ 20 km distance


Legend


Distance to open water bodies [km]:

10.93

Distance to urban areas [km]:

11.33


Radius: 1 km

Number of landcover classes:

3

Dominant landcover type:

10: cropland, rainfed

Fraction of dominant landcover type [%]:

60.0


Radius: 2 km

Number of landcover classes:

4

Dominant landcover type:

10: cropland, rainfed

Fraction of dominant landcover type [%]:

48.0


Radius: 5 km

Number of landcover classes:

5

Dominant landcover type:

10: cropland, rainfed

Fraction of dominant landcover type [%]:

56.0


Radius: 10 km

Number of landcover classes:

4

Dominant landcover type:

10: cropland, rainfed

Fraction of dominant landcover type [%]:

66.0


Radius: 20 km

Number of landcover classes:

6

Dominant landcover type:

10: cropland, rainfed

Fraction of dominant landcover type [%]:

52.0


Disturbances


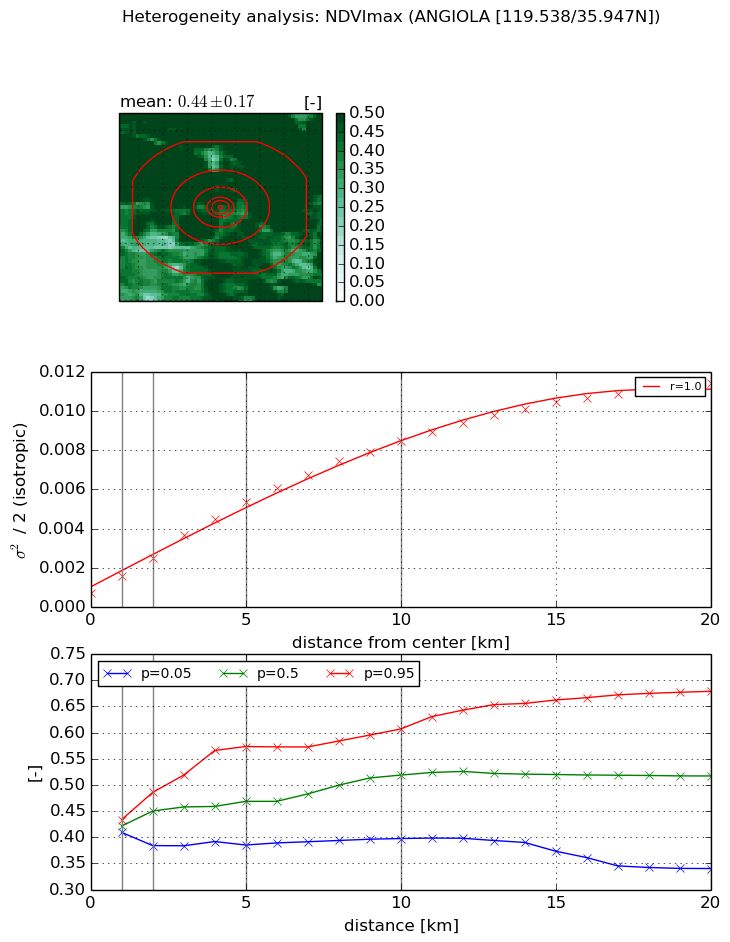
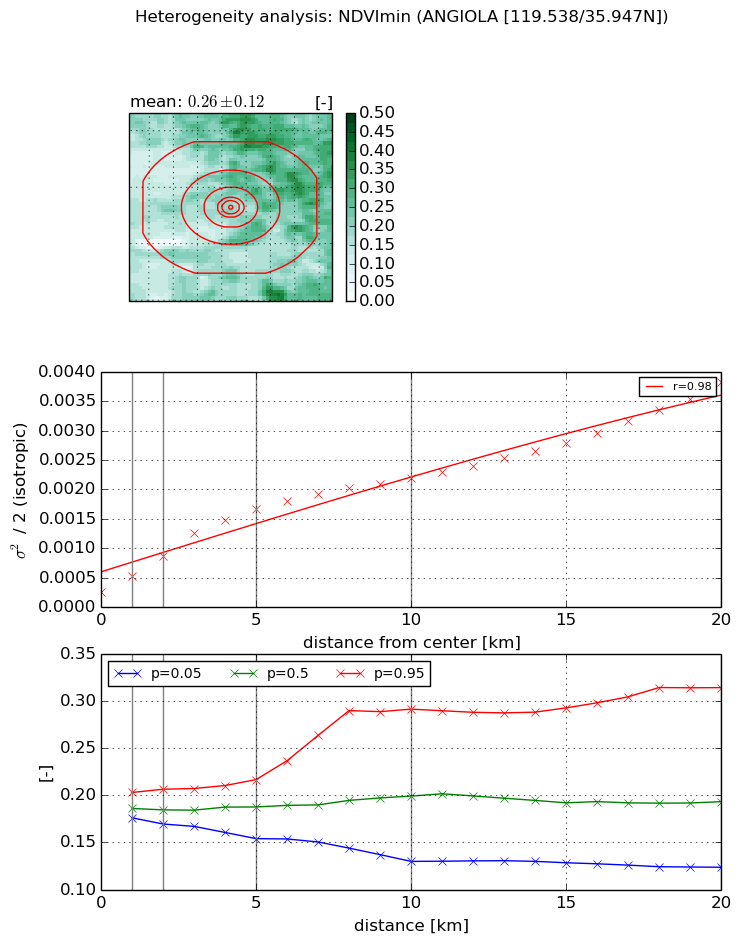
Heterogeneity analysis

The heterogeneity analysis provides information about the spatial and temporal heterogeneity of the site.

Topography


Roman et al. (2009) index


St

0.00224378369404

Rcv

0.0639646196921

Rse

0.0

Rst

3.19856596154e-07

Rsv

1336.96331089


Height range @ 1km [m]

3

Height range @ 2km [m]

3

Height range @ 5km [m]

3

Height range @ 10km [m]

-999

Height range @ 20km [m]

-999


Variance slope @ 1 km

0

Variance slope @ 2 km

0

Variance slope @ 5 km

0

Variance slope @ 10 km

-999

Variance slope @ 20 km

-999


NDVI (max. NDVI composite)


Roman et al. (2009) index


St

1.15548538777e-07

Rcv

0.324676811903

Rse

0.0

Rst

0.150204297297

Rsv

25963114.5221


NDVI range @ 1km [-]

0.02

NDVI range @ 2km [-]

0.1

NDVI range @ 5km [-]

0.19

NDVI range @ 10km [-]

0.21

NDVI range @ 20km [-]

0.34


Variance slope @ 1 km

0.000844168370371

Variance slope @ 2 km

0.000895052122225

Variance slope @ 5 km

0.00094702690608

Variance slope @ 10 km

0.000787592710931

Variance slope @ 20 km

0.000528409934601


NDVI (min. NDVI composite)I


Roman et al. (2009) index


St

1.76534715501

Rcv

0.499305592968

Rse

0.0

Rst

-0.200079926551

Rsv

-0.999996945558


NDVI range @ 1km [-]

0.03

NDVI range @ 2km [-]

0.04

NDVI range @ 5km [-]

0.06

NDVI range @ 10km [-]

0.16

NDVI range @ 20km [-]

0.19


NDVI slope @ 1 km

0.000282633282667

NDVI slope @ 2 km

0.000309560576186

NDVI slope @ 5 km

0.000295156617904

NDVI slope @ 10 km

0.000191731623505

NDVI slope @ 20 km

0.00015143932673


Temporal stability analysis

+000 deg (BHR)


BHR statistics

Temporal stability [1/decade]:


abs

rel


Weighted least square:

None


Ordinary least square:

None


Probabilities that GCOS criteria is met:

Weighted least square:

None %

Ordinary least square:

None %


DHR statistics

Temporal stability [1/decade]:


abs

rel


Weighted least square:

None


Ordinary least square:

None


Probabilities that GCOS criteria is met:

Weighted least square:

None %

Ordinary least square:

None %


+057/+063 deg (BHR)


BHR statistics

Temporal stability [1/decade]:


abs

rel


Weighted least square:

None


Ordinary least square:

None


Probabilities that GCOS criteria is met:

Weighted least square:

None %

Ordinary least square:

None %


DHR statistics

Temporal stability [1/decade]:


abs

rel


Weighted least square:

None


Ordinary least square:

None


Probabilities that GCOS criteria is met:

Weighted least square:

None %

Ordinary least square:

None %


Temporal anomaly analyis

The variance of the temporal anomalies provides an additional measure about the stability of the signal AFTER removal of the mean seasonal cylce.

+000 deg


+057/+063 deg