AU-WAC


Location

lon / lat [deg]: 145.187 / -37.429

Source network: FLUXNET


Geostationary surface albedo (GSA) data


“+000”


“+057/+063”


Landcover information (based on ESA CCI landcover data)


Landcover fractions @ 2km distance


Landcover fractions @ 20 km distance


Legend


Distance to open water bodies [km]:

8.66

Distance to urban areas [km]:

17.49


Radius: 1 km

Number of landcover classes:

1

Dominant landcover type:

50: Tree cover, broadleaved, evergreen, closed to open (>15%)

Fraction of dominant landcover type [%]:

100.0


Radius: 2 km

Number of landcover classes:

1

Dominant landcover type:

50: Tree cover, broadleaved, evergreen, closed to open (>15%)

Fraction of dominant landcover type [%]:

100.0


Radius: 5 km

Number of landcover classes:

3

Dominant landcover type:

50: Tree cover, broadleaved, evergreen, closed to open (>15%)

Fraction of dominant landcover type [%]:

95.0


Radius: 10 km

Number of landcover classes:

6

Dominant landcover type:

50: Tree cover, broadleaved, evergreen, closed to open (>15%)

Fraction of dominant landcover type [%]:

77.0


Radius: 20 km

Number of landcover classes:

6

Dominant landcover type:

50: Tree cover, broadleaved, evergreen, closed to open (>15%)

Fraction of dominant landcover type [%]:

45.0


Disturbances


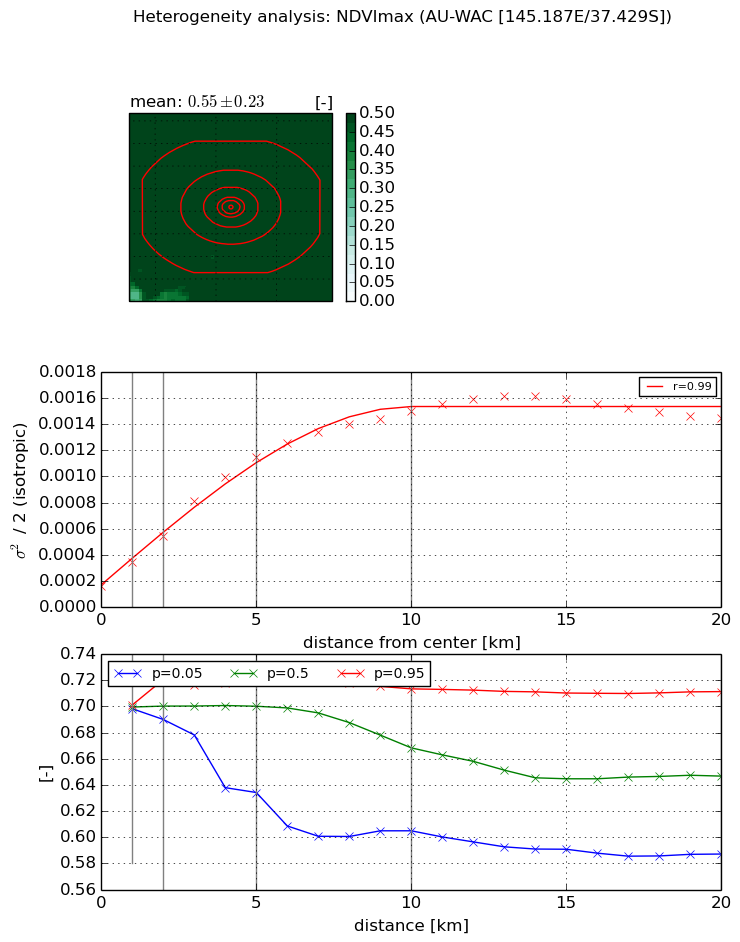
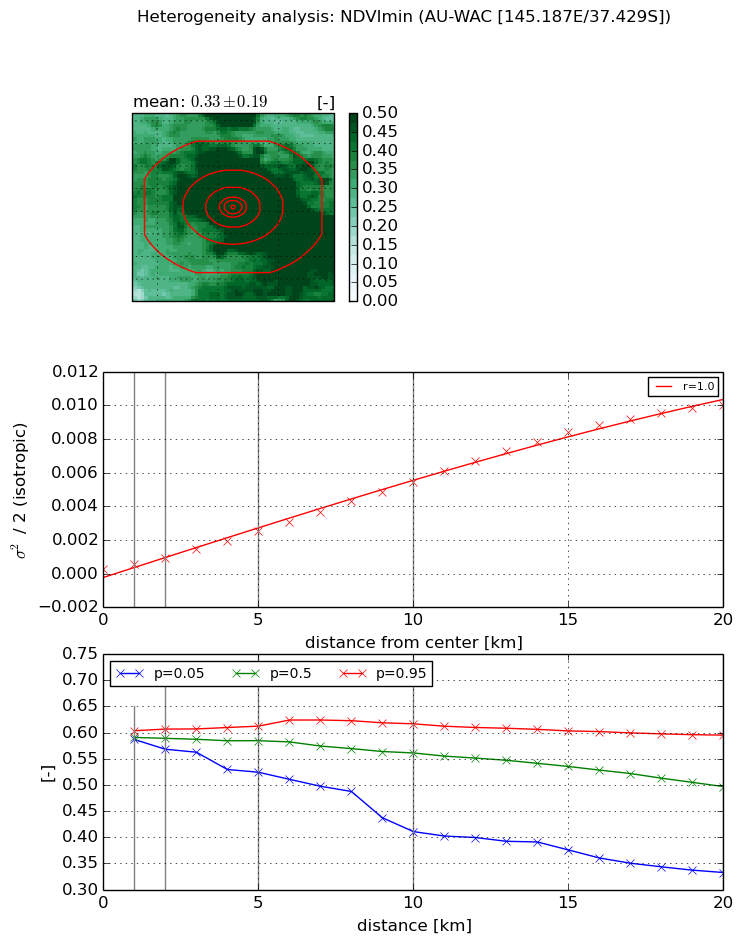
Heterogeneity analysis

The heterogeneity analysis provides information about the spatial and temporal heterogeneity of the site.

Topography


Roman et al. (2009) index


St

1.69477628885

Rcv

0.795243908004

Rse

0.0

Rst

-1.27748991077e-06

Rsv

-0.974899947959


Height range @ 1km [m]

43

Height range @ 2km [m]

123

Height range @ 5km [m]

450

Height range @ 10km [m]

-999

Height range @ 20km [m]

-999


Variance slope @ 1 km

2430

Variance slope @ 2 km

3329

Variance slope @ 5 km

4645

Variance slope @ 10 km

-999

Variance slope @ 20 km

-999


NDVI (max. NDVI composite)


Roman et al. (2009) index


St

1.29961058305

Rcv

1.09190911944

Rse

0.0

Rst

-0.216475078607

Rsv

-0.999999589472


NDVI range @ 1km [-]

0.0

NDVI range @ 2km [-]

0.03

NDVI range @ 5km [-]

0.09

NDVI range @ 10km [-]

0.11

NDVI range @ 20km [-]

0.12


Variance slope @ 1 km

0.000179073415549

Variance slope @ 2 km

0.00019222332977

Variance slope @ 5 km

0.000204113226962

Variance slope @ 10 km

0.000135919615982

Variance slope @ 20 km

5.70083621007e-05


NDVI (min. NDVI composite)I


Roman et al. (2009) index


St

1.17140257963

Rcv

0.904455832124

Rse

0.0

Rst

-0.656576886779

Rsv

-0.999999715358


NDVI range @ 1km [-]

0.02

NDVI range @ 2km [-]

0.04

NDVI range @ 5km [-]

0.09

NDVI range @ 10km [-]

0.21

NDVI range @ 20km [-]

0.26


NDVI slope @ 1 km

0.000296354244961

NDVI slope @ 2 km

0.000326018435792

NDVI slope @ 5 km

0.000458758777232

NDVI slope @ 10 km

0.000538469227102

NDVI slope @ 20 km

0.000535258536757


Temporal stability analysis

+000 deg (BHR)


BHR statistics

Temporal stability [1/decade]:


abs

rel


Weighted least square:

None


Ordinary least square:

None


Probabilities that GCOS criteria is met:

Weighted least square:

None %

Ordinary least square:

None %


DHR statistics

Temporal stability [1/decade]:


abs

rel


Weighted least square:

None


Ordinary least square:

None


Probabilities that GCOS criteria is met:

Weighted least square:

None %

Ordinary least square:

None %


+057/+063 deg (BHR)


BHR statistics

Temporal stability [1/decade]:


abs

rel


Weighted least square:

None


Ordinary least square:

None


Probabilities that GCOS criteria is met:

Weighted least square:

None %

Ordinary least square:

None %


DHR statistics

Temporal stability [1/decade]:


abs

rel


Weighted least square:

None


Ordinary least square:

None


Probabilities that GCOS criteria is met:

Weighted least square:

None %

Ordinary least square:

None %


Temporal anomaly analyis

The variance of the temporal anomalies provides an additional measure about the stability of the signal AFTER removal of the mean seasonal cylce.

+000 deg


+057/+063 deg