BAC_GIANG


Location

lon / lat [deg]: 106.2255 / 21.2914

Source network: AERONET


Geostationary surface albedo (GSA) data


“+000”


“+057/+063”


Landcover information (based on ESA CCI landcover data)


Landcover fractions @ 2km distance


Landcover fractions @ 20 km distance


Legend


Distance to open water bodies [km]:

2.04

Distance to urban areas [km]:

0.27


Radius: 1 km

Number of landcover classes:

3

Dominant landcover type:

190: urban areas

Fraction of dominant landcover type [%]:

41.0


Radius: 2 km

Number of landcover classes:

4

Dominant landcover type:

190: urban areas

Fraction of dominant landcover type [%]:

40.0


Radius: 5 km

Number of landcover classes:

4

Dominant landcover type:

10: cropland, rainfed

Fraction of dominant landcover type [%]:

46.0


Radius: 10 km

Number of landcover classes:

7

Dominant landcover type:

10: cropland, rainfed

Fraction of dominant landcover type [%]:

49.0


Radius: 20 km

Number of landcover classes:

7

Dominant landcover type:

10: cropland, rainfed

Fraction of dominant landcover type [%]:

53.0


Disturbances


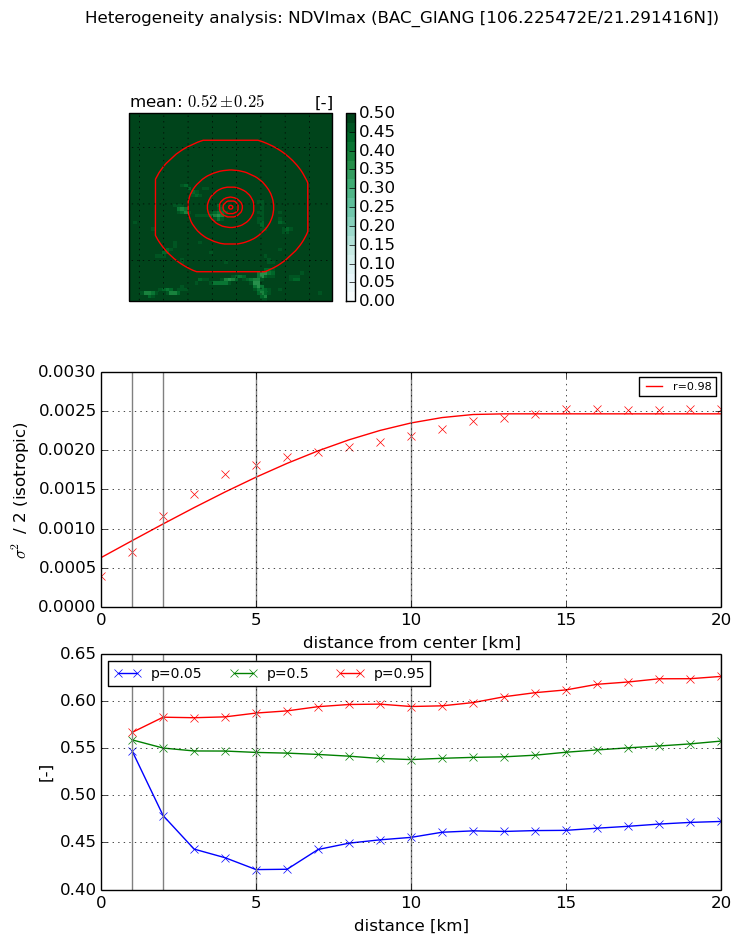
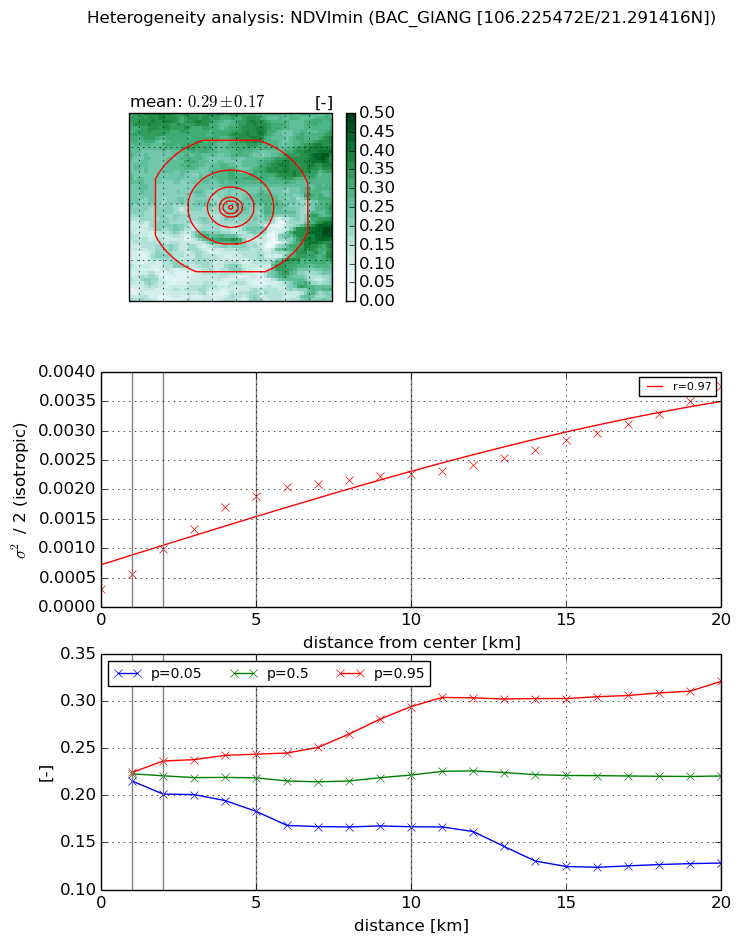
Heterogeneity analysis

The heterogeneity analysis provides information about the spatial and temporal heterogeneity of the site.

Topography


Roman et al. (2009) index


St

2.13199067356

Rcv

0.129374709329

Rse

0.0

Rst

0.62276227894

Rsv

-0.654998623158


Height range @ 1km [m]

8

Height range @ 2km [m]

6

Height range @ 5km [m]

8

Height range @ 10km [m]

-999

Height range @ 20km [m]

-999


Variance slope @ 1 km

6

Variance slope @ 2 km

2

Variance slope @ 5 km

0

Variance slope @ 10 km

-999

Variance slope @ 20 km

-999


NDVI (max. NDVI composite)


Roman et al. (2009) index


St

6.97038676543

Rcv

0.178343169836

Rse

0.0

Rst

0.0113630687419

Rsv

0.240685947818


NDVI range @ 1km [-]

0.02

NDVI range @ 2km [-]

0.1

NDVI range @ 5km [-]

0.17

NDVI range @ 10km [-]

0.14

NDVI range @ 20km [-]

0.15


Variance slope @ 1 km

0.000299833098852

Variance slope @ 2 km

0.000382233620024

Variance slope @ 5 km

0.000294039931424

Variance slope @ 10 km

0.00016717995279

Variance slope @ 20 km

8.94956958005e-05


NDVI (min. NDVI composite)I


Roman et al. (2009) index


St

1.49721673865

Rcv

0.588023851797

Rse

0.0

Rst

-0.415694165364

Rsv

-0.999999896588


NDVI range @ 1km [-]

0.01

NDVI range @ 2km [-]

0.04

NDVI range @ 5km [-]

0.06

NDVI range @ 10km [-]

0.13

NDVI range @ 20km [-]

0.19


NDVI slope @ 1 km

0.000253088081294

NDVI slope @ 2 km

0.000346783111958

NDVI slope @ 5 km

0.000335092249604

NDVI slope @ 10 km

0.000198153000104

NDVI slope @ 20 km

0.000141050494256


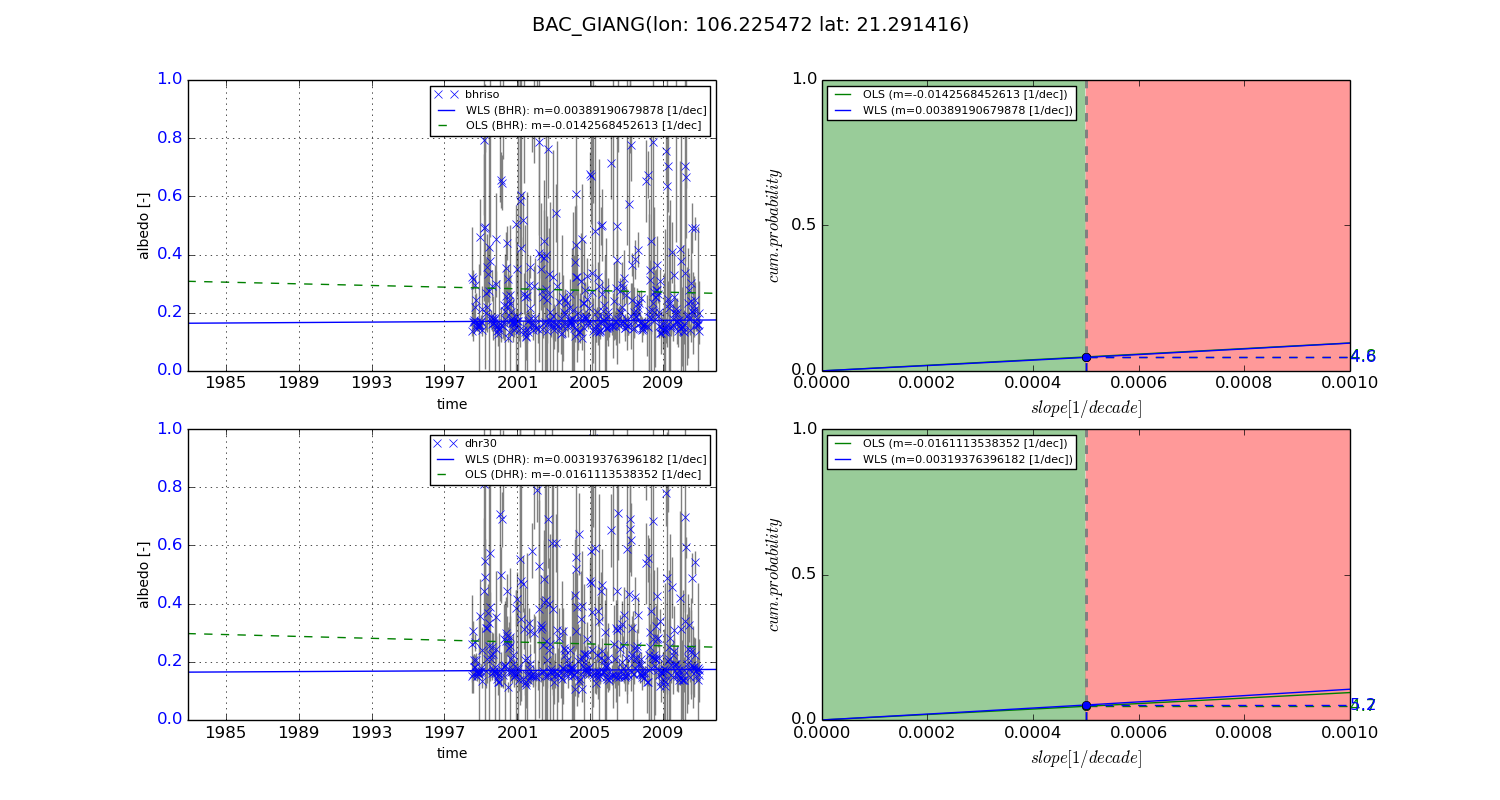
Temporal stability analysis

+000 deg (BHR)


BHR statistics

Temporal stability [1/decade]:


abs

rel


Weighted least square:

None


Ordinary least square:

None


Probabilities that GCOS criteria is met:

Weighted least square:

None %

Ordinary least square:

None %


DHR statistics

Temporal stability [1/decade]:


abs

rel


Weighted least square:

None


Ordinary least square:

None


Probabilities that GCOS criteria is met:

Weighted least square:

None %

Ordinary least square:

None %


+057/+063 deg (BHR)


BHR statistics

Temporal stability [1/decade]:


abs

rel


Weighted least square:

0.00389190679878


Ordinary least square:

-0.0142568452613


Probabilities that GCOS criteria is met:

Weighted least square:

4.6 %

Ordinary least square:

4.8 %


DHR statistics

Temporal stability [1/decade]:


abs

rel


Weighted least square:

0.00319376396182


Ordinary least square:

-0.0161113538352


Probabilities that GCOS criteria is met:

Weighted least square:

5.2 %

Ordinary least square:

4.7 %


Temporal anomaly analyis

The variance of the temporal anomalies provides an additional measure about the stability of the signal AFTER removal of the mean seasonal cylce.

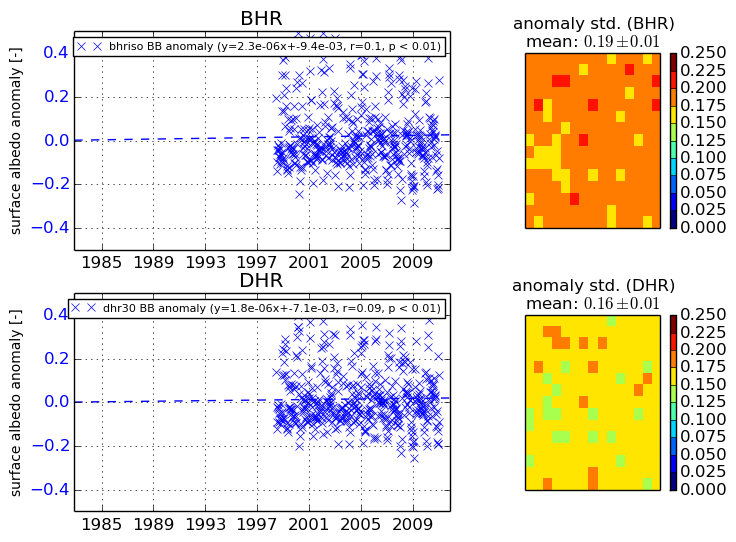
+000 deg


+057/+063 deg