BALBINA


Location

lon / lat [deg]: -59.4868 / -1.917

Source network: AERONET


Geostationary surface albedo (GSA) data


“+000”


“+057/+063”


Landcover information (based on ESA CCI landcover data)


Landcover fractions @ 2km distance


Landcover fractions @ 20 km distance


Legend


Distance to open water bodies [km]:

0.14

Distance to urban areas [km]:

8.31


Radius: 1 km

Number of landcover classes:

1

Dominant landcover type:

210: water bodies

Fraction of dominant landcover type [%]:

100.0


Radius: 2 km

Number of landcover classes:

3

Dominant landcover type:

210: water bodies

Fraction of dominant landcover type [%]:

85.0


Radius: 5 km

Number of landcover classes:

2

Dominant landcover type:

210: water bodies

Fraction of dominant landcover type [%]:

54.0


Radius: 10 km

Number of landcover classes:

2

Dominant landcover type:

50: Tree cover, broadleaved, evergreen, closed to open (>15%)

Fraction of dominant landcover type [%]:

53.0


Radius: 20 km

Number of landcover classes:

2

Dominant landcover type:

50: Tree cover, broadleaved, evergreen, closed to open (>15%)

Fraction of dominant landcover type [%]:

59.0


Disturbances


Heterogeneity analysis

The heterogeneity analysis provides information about the spatial and temporal heterogeneity of the site.

Topography


Roman et al. (2009) index


St

2.21084150779

Rcv

0.193656272077

Rse

0.0

Rst

6.10175109067e-07

Rsv

1.16329249174


Height range @ 1km [m]

36

Height range @ 2km [m]

67

Height range @ 5km [m]

116

Height range @ 10km [m]

-999

Height range @ 20km [m]

-999


Variance slope @ 1 km

56

Variance slope @ 2 km

116

Variance slope @ 5 km

281

Variance slope @ 10 km

-999

Variance slope @ 20 km

-999


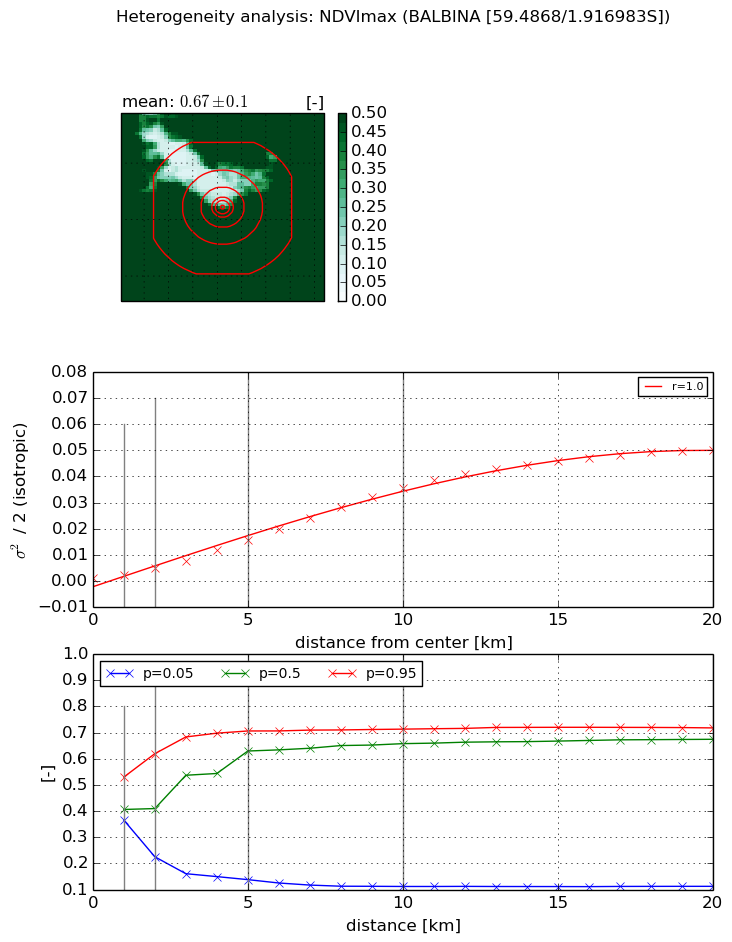
NDVI (max. NDVI composite)


Roman et al. (2009) index


St

8.85960300805e-08

Rcv

0.0583195400638

Rse

0.0

Rst

0.198226324737

Rsv

33861562.1326


NDVI range @ 1km [-]

0.16

NDVI range @ 2km [-]

0.39

NDVI range @ 5km [-]

0.57

NDVI range @ 10km [-]

0.6

NDVI range @ 20km [-]

0.61


Variance slope @ 1 km

0.00126028827308

Variance slope @ 2 km

0.0018792994423

Variance slope @ 5 km

0.00295149065825

Variance slope @ 10 km

0.00362645185381

Variance slope @ 20 km

0.00272670614109


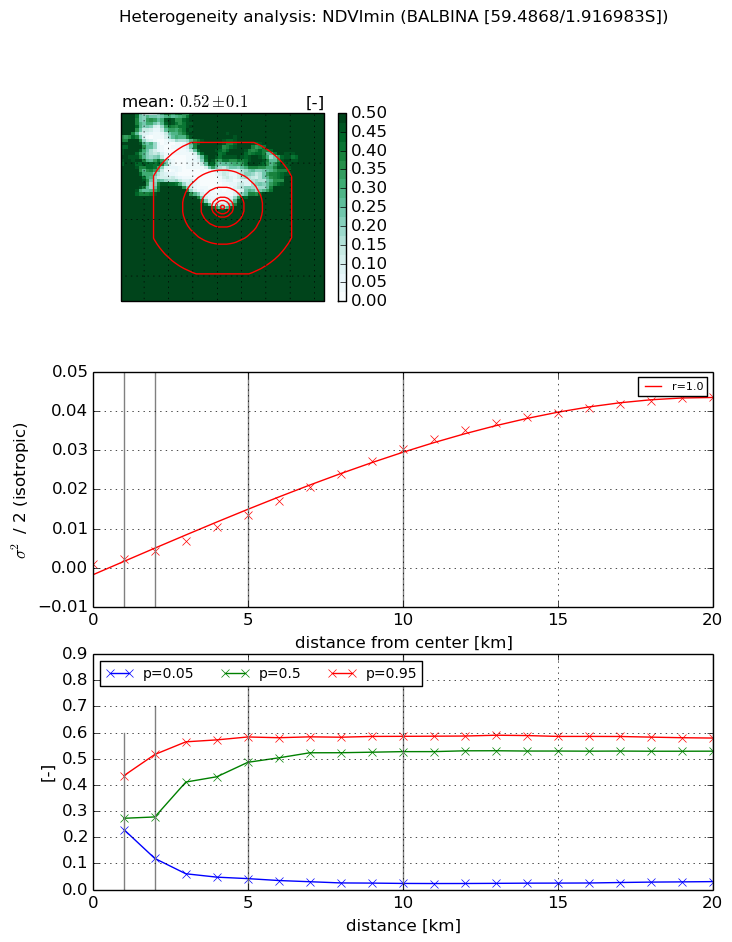
NDVI (min. NDVI composite)I


Roman et al. (2009) index


St

1.41199520681e-06

Rcv

0.0328782287067

Rse

0.0

Rst

0.198896742188

Rsv

2124652.87295


NDVI range @ 1km [-]

0.21

NDVI range @ 2km [-]

0.4

NDVI range @ 5km [-]

0.54

NDVI range @ 10km [-]

0.56

NDVI range @ 20km [-]

0.55


NDVI slope @ 1 km

0.00111913816426

NDVI slope @ 2 km

0.00165984000676

NDVI slope @ 5 km

0.00255257871943

NDVI slope @ 10 km

0.00307920452303

NDVI slope @ 20 km

0.00235904630127


Temporal stability analysis

+000 deg (BHR)


BHR statistics

Temporal stability [1/decade]:


abs

rel


Weighted least square:

-99999.0


Ordinary least square:

-99999.0


Probabilities that GCOS criteria is met:

Weighted least square:

-99999.0 %

Ordinary least square:

-99999.0 %


DHR statistics

Temporal stability [1/decade]:


abs

rel


Weighted least square:

-99999.0


Ordinary least square:

-99999.0


Probabilities that GCOS criteria is met:

Weighted least square:

-99999.0 %

Ordinary least square:

-99999.0 %


+057/+063 deg (BHR)


BHR statistics

Temporal stability [1/decade]:


abs

rel


Weighted least square:

None


Ordinary least square:

None


Probabilities that GCOS criteria is met:

Weighted least square:

None %

Ordinary least square:

None %


DHR statistics

Temporal stability [1/decade]:


abs

rel


Weighted least square:

None


Ordinary least square:

None


Probabilities that GCOS criteria is met:

Weighted least square:

None %

Ordinary least square:

None %


Temporal anomaly analyis

The variance of the temporal anomalies provides an additional measure about the stability of the signal AFTER removal of the mean seasonal cylce.

+000 deg


+057/+063 deg