BE-BRA


Location

lon / lat [deg]: 4.5206 / 51.3092

Source network: FLUXNET


Geostationary surface albedo (GSA) data


“+000”


“+057/+063”


Landcover information (based on ESA CCI landcover data)


Landcover fractions @ 2km distance


Landcover fractions @ 20 km distance


Legend


Distance to open water bodies [km]:

1.47

Distance to urban areas [km]:

0.52


Radius: 1 km

Number of landcover classes:

3

Dominant landcover type:

90: Tree cover, mixed leaf type

Fraction of dominant landcover type [%]:

54.0


Radius: 2 km

Number of landcover classes:

3

Dominant landcover type:

190: urban areas

Fraction of dominant landcover type [%]:

73.0


Radius: 5 km

Number of landcover classes:

8

Dominant landcover type:

190: urban areas

Fraction of dominant landcover type [%]:

63.0


Radius: 10 km

Number of landcover classes:

9

Dominant landcover type:

190: urban areas

Fraction of dominant landcover type [%]:

60.0


Radius: 20 km

Number of landcover classes:

10

Dominant landcover type:

190: urban areas

Fraction of dominant landcover type [%]:

48.0


Disturbances


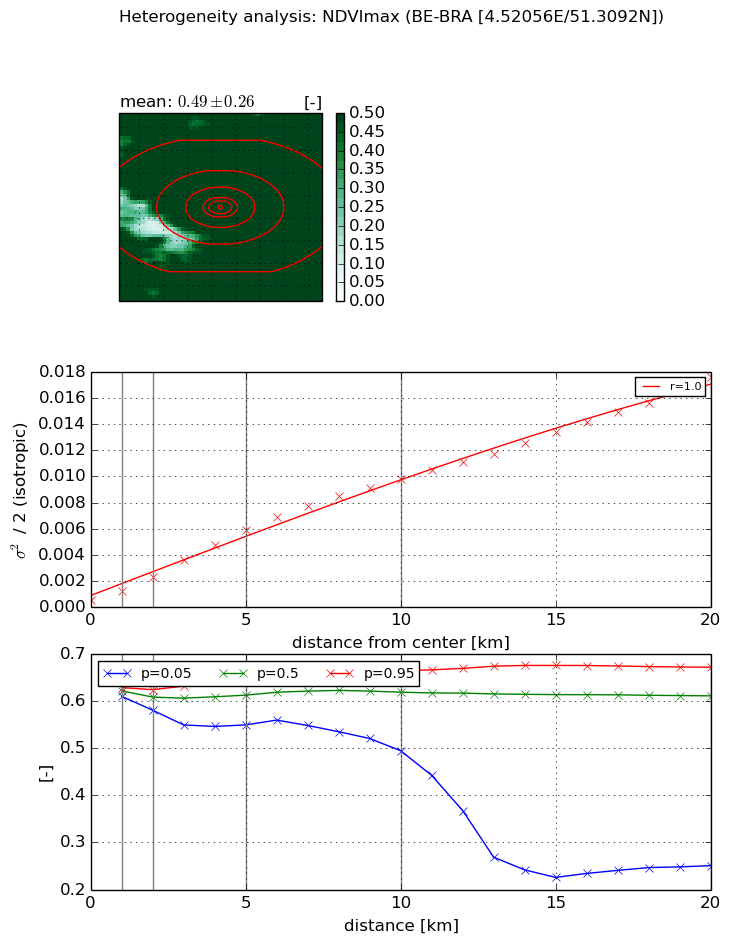
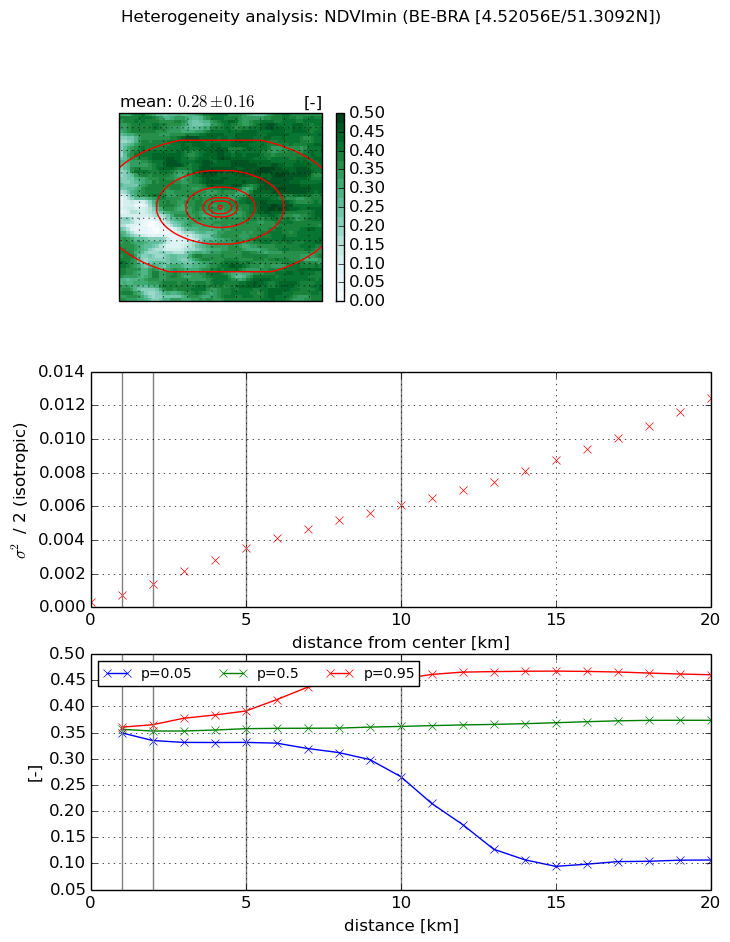
Heterogeneity analysis

The heterogeneity analysis provides information about the spatial and temporal heterogeneity of the site.

Topography


Roman et al. (2009) index


St

2.52076571275

Rcv

0.182172006503

Rse

0.0

Rst

-0.00794261818608

Rsv

-0.9999999444


Height range @ 1km [m]

12

Height range @ 2km [m]

17

Height range @ 5km [m]

21

Height range @ 10km [m]

-999

Height range @ 20km [m]

-999


Variance slope @ 1 km

9

Variance slope @ 2 km

7

Variance slope @ 5 km

7

Variance slope @ 10 km

-999

Variance slope @ 20 km

-999


NDVI (max. NDVI composite)


Roman et al. (2009) index


St

5.170084261e-07

Rcv

0.0234148192323

Rse

0.0

Rst

0.715528281653

Rsv

5802612.62005


NDVI range @ 1km [-]

0.02

NDVI range @ 2km [-]

0.04

NDVI range @ 5km [-]

0.1

NDVI range @ 10km [-]

0.17

NDVI range @ 20km [-]

0.42


Variance slope @ 1 km

0.000713819778838

Variance slope @ 2 km

0.000885323798166

Variance slope @ 5 km

0.00109863408084

Variance slope @ 10 km

0.000967533725849

Variance slope @ 20 km

0.000816839640698


NDVI (min. NDVI composite)I


Roman et al. (2009) index


St

5.3666304308e-07

Rcv

0.330182976489

Rse

0.0

Rst

-0.140344656991

Rsv

5590099.38576


NDVI range @ 1km [-]

0.01

NDVI range @ 2km [-]

0.03

NDVI range @ 5km [-]

0.06

NDVI range @ 10km [-]

0.19

NDVI range @ 20km [-]

0.35


NDVI slope @ 1 km

0.000412893629376

NDVI slope @ 2 km

0.000513154905122

NDVI slope @ 5 km

0.000648403216236

NDVI slope @ 10 km

0.000599910237054

NDVI slope @ 20 km

0.000576575673575


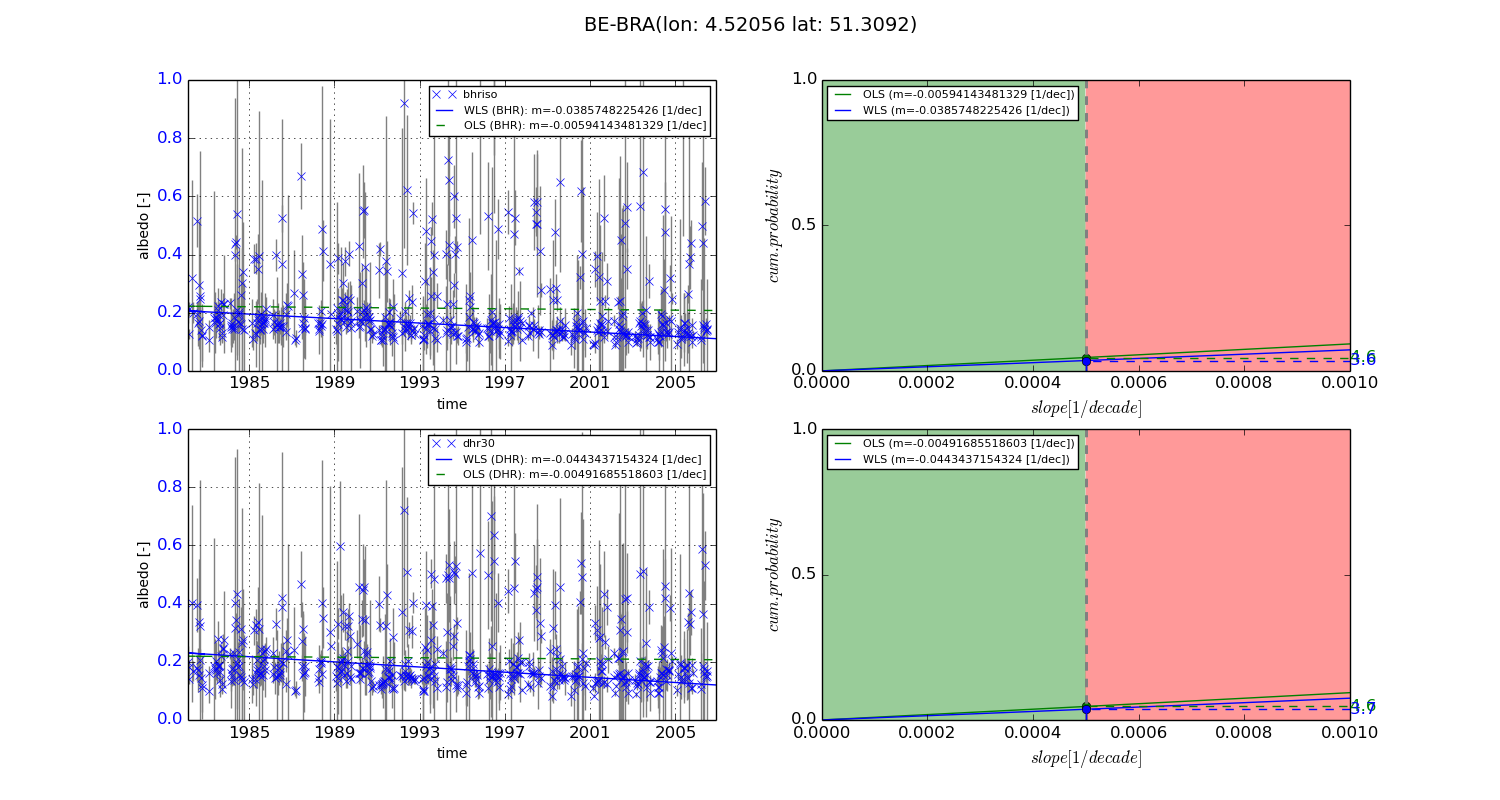
Temporal stability analysis

+000 deg (BHR)


BHR statistics

Temporal stability [1/decade]:


abs

rel


Weighted least square:

-0.0385748225426


Ordinary least square:

-0.00594143481329


Probabilities that GCOS criteria is met:

Weighted least square:

3.6 %

Ordinary least square:

4.6 %


DHR statistics

Temporal stability [1/decade]:


abs

rel


Weighted least square:

-0.0443437154324


Ordinary least square:

-0.00491685518603


Probabilities that GCOS criteria is met:

Weighted least square:

3.7 %

Ordinary least square:

4.6 %


+057/+063 deg (BHR)


BHR statistics

Temporal stability [1/decade]:


abs

rel


Weighted least square:

-99999.0


Ordinary least square:

-99999.0


Probabilities that GCOS criteria is met:

Weighted least square:

-99999.0 %

Ordinary least square:

-99999.0 %


DHR statistics

Temporal stability [1/decade]:


abs

rel


Weighted least square:

-99999.0


Ordinary least square:

-99999.0


Probabilities that GCOS criteria is met:

Weighted least square:

-99999.0 %

Ordinary least square:

-99999.0 %


Temporal anomaly analyis

The variance of the temporal anomalies provides an additional measure about the stability of the signal AFTER removal of the mean seasonal cylce.
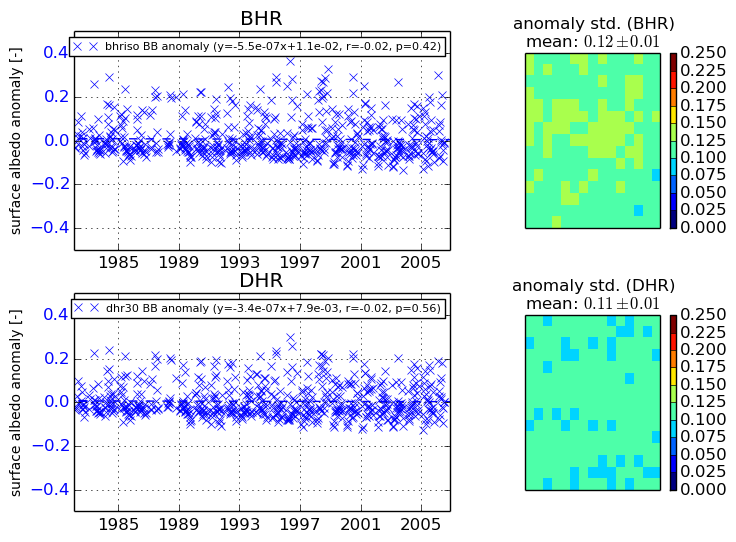
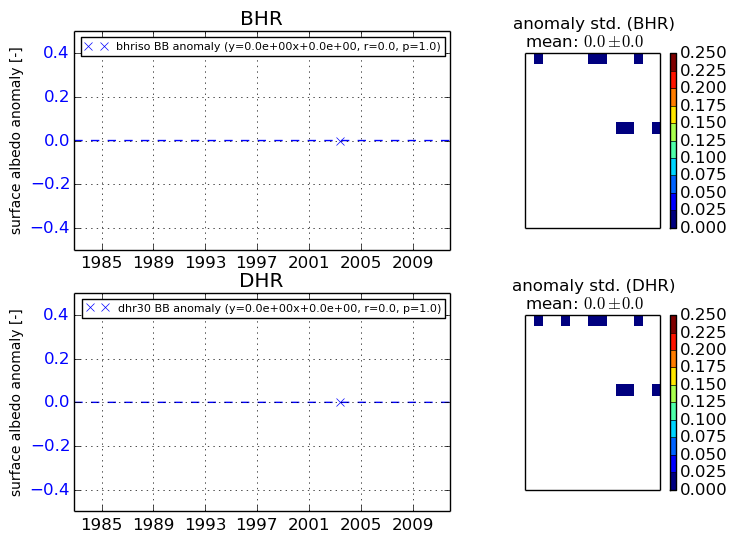
+000 deg


+057/+063 deg