BELMANIP_00027


Location

lon / lat [deg]: -39.9664 / -11.0438

Source network: BELMANIP


Geostationary surface albedo (GSA) data


“+000”


“+057/+063”


Landcover information (based on ESA CCI landcover data)


Landcover fractions @ 2km distance


Landcover fractions @ 20 km distance


Legend


Distance to open water bodies [km]:

3.98

Distance to urban areas [km]:

17.56


Radius: 1 km

Number of landcover classes:

1

Dominant landcover type:

30: mosaic cropland (>50%), natural veg. (< 50%)

Fraction of dominant landcover type [%]:

100.0


Radius: 2 km

Number of landcover classes:

1

Dominant landcover type:

30: mosaic cropland (>50%), natural veg. (< 50%)

Fraction of dominant landcover type [%]:

100.0


Radius: 5 km

Number of landcover classes:

2

Dominant landcover type:

30: mosaic cropland (>50%), natural veg. (< 50%)

Fraction of dominant landcover type [%]:

96.0


Radius: 10 km

Number of landcover classes:

3

Dominant landcover type:

30: mosaic cropland (>50%), natural veg. (< 50%)

Fraction of dominant landcover type [%]:

96.0


Radius: 20 km

Number of landcover classes:

3

Dominant landcover type:

30: mosaic cropland (>50%), natural veg. (< 50%)

Fraction of dominant landcover type [%]:

95.0


Disturbances


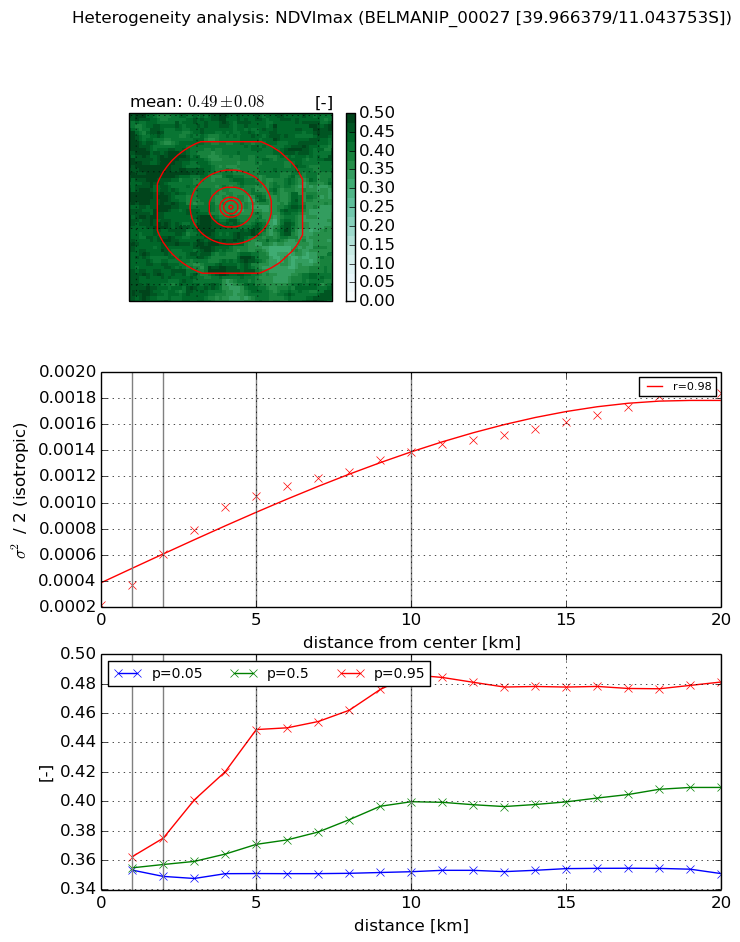
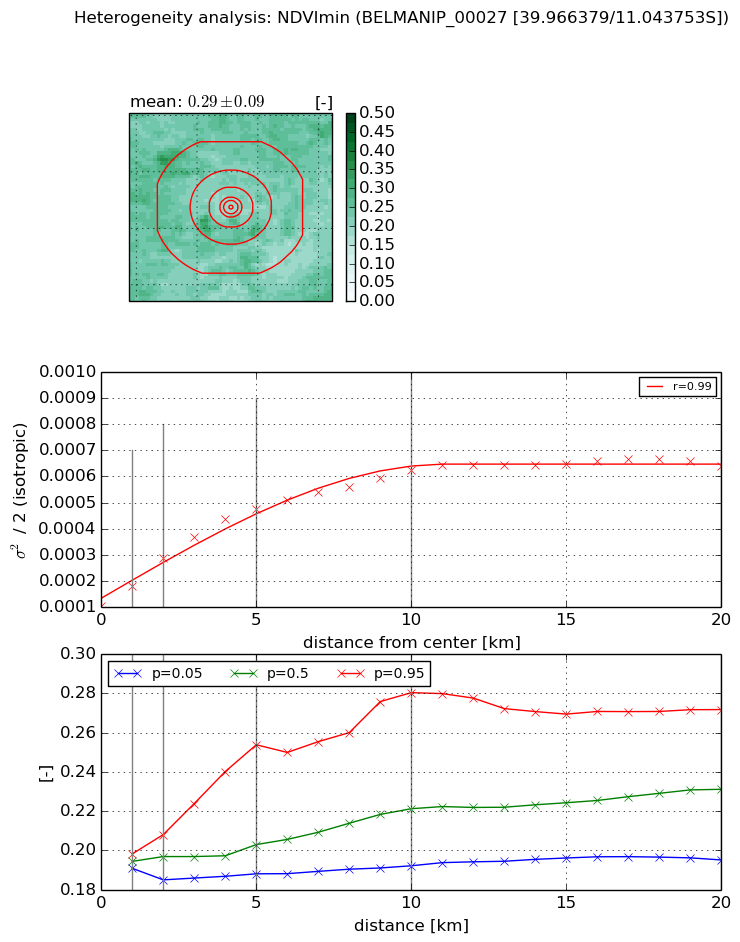
Heterogeneity analysis

The heterogeneity analysis provides information about the spatial and temporal heterogeneity of the site.

Topography


Roman et al. (2009) index


St

1.50551112887e-14

Rcv

0.467308301586

Rse

0.0

Rst

2.1335849995e-05

Rsv

1.99267872716e+14


Height range @ 1km [m]

22

Height range @ 2km [m]

33

Height range @ 5km [m]

60

Height range @ 10km [m]

-999

Height range @ 20km [m]

-999


Variance slope @ 1 km

50

Variance slope @ 2 km

44

Variance slope @ 5 km

61

Variance slope @ 10 km

-999

Variance slope @ 20 km

-999


NDVI (max. NDVI composite)


Roman et al. (2009) index


St

0.87813119346

Rcv

0.649365336304

Rse

0.0

Rst

-0.0187701057161

Rsv

2.74821056908


NDVI range @ 1km [-]

0.01

NDVI range @ 2km [-]

0.03

NDVI range @ 5km [-]

0.1

NDVI range @ 10km [-]

0.13

NDVI range @ 20km [-]

0.13


Variance slope @ 1 km

0.000153329511592

Variance slope @ 2 km

0.000197663875214

Variance slope @ 5 km

0.000175954319525

Variance slope @ 10 km

0.000113939595639

Variance slope @ 20 km

7.30394267735e-05


NDVI (min. NDVI composite)I


Roman et al. (2009) index


St

2.19571905354

Rcv

0.61377505334

Rse

0.0

Rst

-0.304620828746

Rsv

0.447899134193


NDVI range @ 1km [-]

0.01

NDVI range @ 2km [-]

0.02

NDVI range @ 5km [-]

0.07

NDVI range @ 10km [-]

0.09

NDVI range @ 20km [-]

0.08


NDVI slope @ 1 km

7.36152851558e-05

NDVI slope @ 2 km

9.13834316961e-05

NDVI slope @ 5 km

7.69675026636e-05

NDVI slope @ 10 km

4.9833883772e-05

NDVI slope @ 20 km

2.33817113949e-05


Temporal stability analysis

+000 deg (BHR)


BHR statistics

Temporal stability [1/decade]:


abs

rel


Weighted least square:

-99999.0


Ordinary least square:

-99999.0


Probabilities that GCOS criteria is met:

Weighted least square:

-99999.0 %

Ordinary least square:

-99999.0 %


DHR statistics

Temporal stability [1/decade]:


abs

rel


Weighted least square:

-99999.0


Ordinary least square:

-99999.0


Probabilities that GCOS criteria is met:

Weighted least square:

-99999.0 %

Ordinary least square:

-99999.0 %


+057/+063 deg (BHR)


BHR statistics

Temporal stability [1/decade]:


abs

rel


Weighted least square:

None


Ordinary least square:

None


Probabilities that GCOS criteria is met:

Weighted least square:

None %

Ordinary least square:

None %


DHR statistics

Temporal stability [1/decade]:


abs

rel


Weighted least square:

None


Ordinary least square:

None


Probabilities that GCOS criteria is met:

Weighted least square:

None %

Ordinary least square:

None %


Temporal anomaly analyis

The variance of the temporal anomalies provides an additional measure about the stability of the signal AFTER removal of the mean seasonal cylce.

+000 deg


+057/+063 deg