BELMANIP_00053


Location

lon / lat [deg]: -89.7555 / 14.5577

Source network: BELMANIP


Geostationary surface albedo (GSA) data


“+000”


“+057/+063”


Landcover information (based on ESA CCI landcover data)


Landcover fractions @ 2km distance


Landcover fractions @ 20 km distance


Legend


Distance to open water bodies [km]:

12.14

Distance to urban areas [km]:

9.26


Radius: 1 km

Number of landcover classes:

1

Dominant landcover type:

11: cropland, rainfed, herbaceous cover

Fraction of dominant landcover type [%]:

100.0


Radius: 2 km

Number of landcover classes:

3

Dominant landcover type:

11: cropland, rainfed, herbaceous cover

Fraction of dominant landcover type [%]:

83.0


Radius: 5 km

Number of landcover classes:

3

Dominant landcover type:

11: cropland, rainfed, herbaceous cover

Fraction of dominant landcover type [%]:

76.0


Radius: 10 km

Number of landcover classes:

5

Dominant landcover type:

11: cropland, rainfed, herbaceous cover

Fraction of dominant landcover type [%]:

58.0


Radius: 20 km

Number of landcover classes:

6

Dominant landcover type:

11: cropland, rainfed, herbaceous cover

Fraction of dominant landcover type [%]:

52.0


Disturbances


Heterogeneity analysis

The heterogeneity analysis provides information about the spatial and temporal heterogeneity of the site.

Topography


Roman et al. (2009) index


St

2.24744730839

Rcv

0.30905317745

Rse

0.0

Rst

-0.0257963932471

Rsv

-0.999998186937


Height range @ 1km [m]

239

Height range @ 2km [m]

280

Height range @ 5km [m]

399

Height range @ 10km [m]

-999

Height range @ 20km [m]

-999


Variance slope @ 1 km

3185

Variance slope @ 2 km

3063

Variance slope @ 5 km

3324

Variance slope @ 10 km

-999

Variance slope @ 20 km

-999


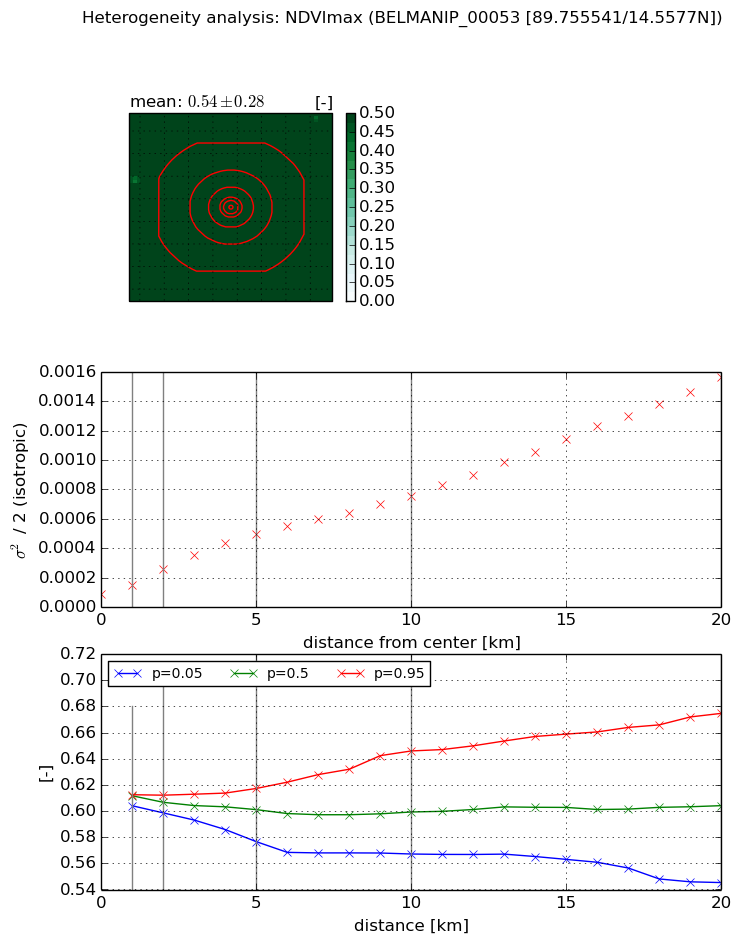
NDVI (max. NDVI composite)


Roman et al. (2009) index


St

1.19717001518

Rcv

0.941844560291

Rse

0.0

Rst

-0.564065365154

Rsv

-0.999999813318


NDVI range @ 1km [-]

0.01

NDVI range @ 2km [-]

0.01

NDVI range @ 5km [-]

0.04

NDVI range @ 10km [-]

0.08

NDVI range @ 20km [-]

0.13


Variance slope @ 1 km

6.26256731762e-05

Variance slope @ 2 km

8.35399520831e-05

Variance slope @ 5 km

8.58984472222e-05

Variance slope @ 10 km

6.63392207967e-05

Variance slope @ 20 km

7.01548405309e-05


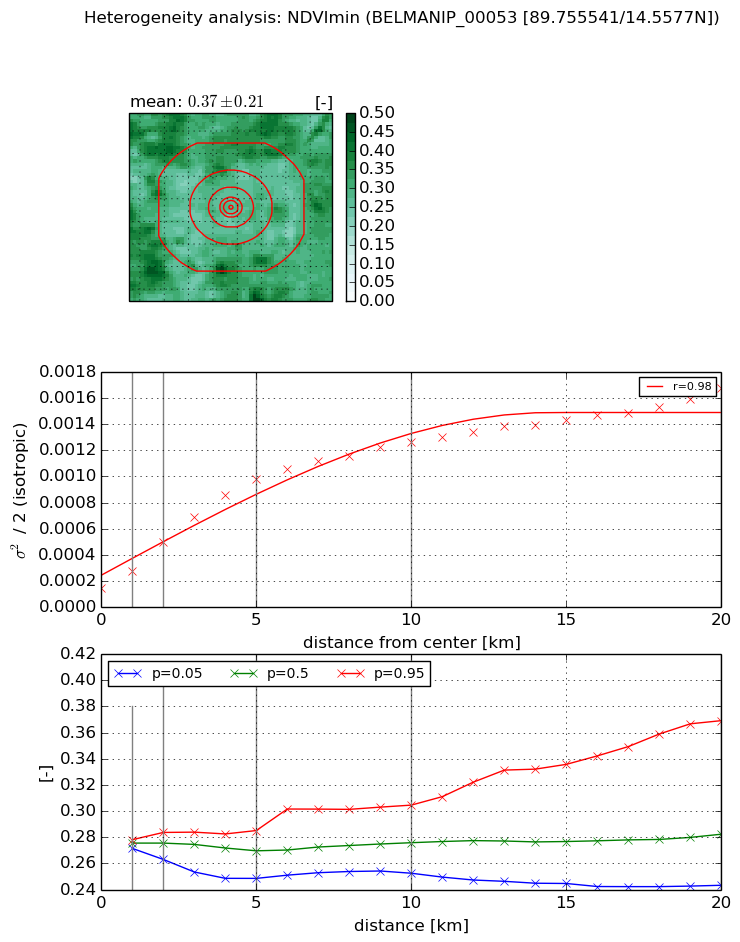
NDVI (min. NDVI composite)I


Roman et al. (2009) index


St

4.44350105006

Rcv

0.158942316712

Rse

0.0

Rst

-0.0890595955837

Rsv

0.427141396145


NDVI range @ 1km [-]

0.01

NDVI range @ 2km [-]

0.02

NDVI range @ 5km [-]

0.04

NDVI range @ 10km [-]

0.05

NDVI range @ 20km [-]

0.13


NDVI slope @ 1 km

0.0001295320334

NDVI slope @ 2 km

0.000173912443538

NDVI slope @ 5 km

0.00017437888402

NDVI slope @ 10 km

0.000113033392473

NDVI slope @ 20 km

6.42754032248e-05


Temporal stability analysis

+000 deg (BHR)


BHR statistics

Temporal stability [1/decade]:


abs

rel


Weighted least square:

None


Ordinary least square:

None


Probabilities that GCOS criteria is met:

Weighted least square:

None %

Ordinary least square:

None %


DHR statistics

Temporal stability [1/decade]:


abs

rel


Weighted least square:

None


Ordinary least square:

None


Probabilities that GCOS criteria is met:

Weighted least square:

None %

Ordinary least square:

None %


+057/+063 deg (BHR)


BHR statistics

Temporal stability [1/decade]:


abs

rel


Weighted least square:

None


Ordinary least square:

None


Probabilities that GCOS criteria is met:

Weighted least square:

None %

Ordinary least square:

None %


DHR statistics

Temporal stability [1/decade]:


abs

rel


Weighted least square:

None


Ordinary least square:

None


Probabilities that GCOS criteria is met:

Weighted least square:

None %

Ordinary least square:

None %


Temporal anomaly analyis

The variance of the temporal anomalies provides an additional measure about the stability of the signal AFTER removal of the mean seasonal cylce.

+000 deg


+057/+063 deg