BELMANIP_00070


Location

lon / lat [deg]: -97.0654 / 32.1832

Source network: BELMANIP


Geostationary surface albedo (GSA) data


“+000”


“+057/+063”


Landcover information (based on ESA CCI landcover data)


Landcover fractions @ 2km distance


Landcover fractions @ 20 km distance


Legend


Distance to open water bodies [km]:

6.31

Distance to urban areas [km]:

7.46


Radius: 1 km

Number of landcover classes:

1

Dominant landcover type:

130: grassland

Fraction of dominant landcover type [%]:

100.0


Radius: 2 km

Number of landcover classes:

2

Dominant landcover type:

130: grassland

Fraction of dominant landcover type [%]:

99.0


Radius: 5 km

Number of landcover classes:

2

Dominant landcover type:

130: grassland

Fraction of dominant landcover type [%]:

98.0


Radius: 10 km

Number of landcover classes:

2

Dominant landcover type:

130: grassland

Fraction of dominant landcover type [%]:

92.0


Radius: 20 km

Number of landcover classes:

2

Dominant landcover type:

130: grassland

Fraction of dominant landcover type [%]:

84.0


Disturbances


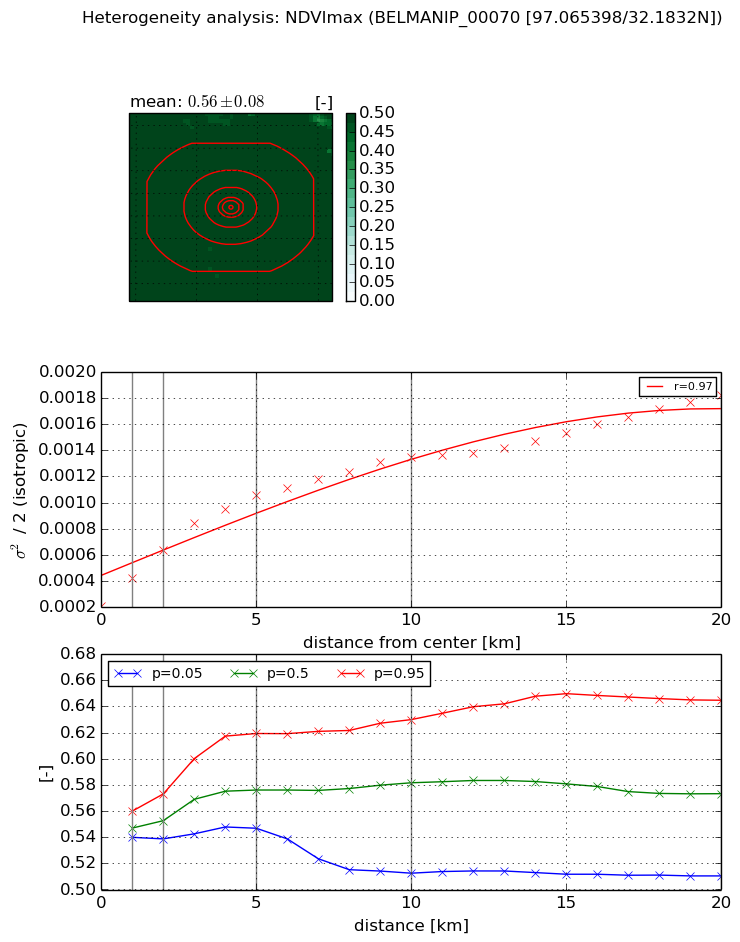
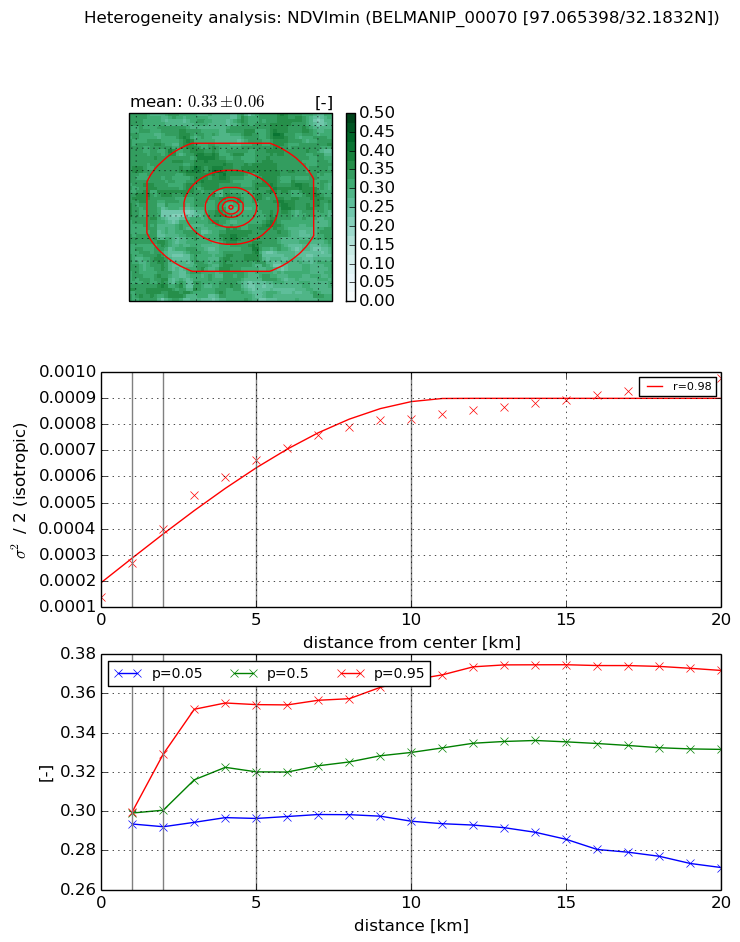
Heterogeneity analysis

The heterogeneity analysis provides information about the spatial and temporal heterogeneity of the site.

Topography


Roman et al. (2009) index


St

4.06592141297

Rcv

0.651914066006

Rse

0.0

Rst

0.0469819969166

Rsv

-0.0389440710323


Height range @ 1km [m]

21

Height range @ 2km [m]

26

Height range @ 5km [m]

51

Height range @ 10km [m]

-999

Height range @ 20km [m]

-999


Variance slope @ 1 km

93

Variance slope @ 2 km

113

Variance slope @ 5 km

78

Variance slope @ 10 km

-999

Variance slope @ 20 km

-999


NDVI (max. NDVI composite)


Roman et al. (2009) index


St

4.80529173242

Rcv

0.223265596115

Rse

0.0

Rst

-0.074923636322

Rsv

0.326122498682


NDVI range @ 1km [-]

0.02

NDVI range @ 2km [-]

0.03

NDVI range @ 5km [-]

0.07

NDVI range @ 10km [-]

0.12

NDVI range @ 20km [-]

0.13


Variance slope @ 1 km

0.000210422228833

Variance slope @ 2 km

0.000212694763197

Variance slope @ 5 km

0.000172413437543

Variance slope @ 10 km

0.000107671506915

Variance slope @ 20 km

6.66461942666e-05


NDVI (min. NDVI composite)I


Roman et al. (2009) index


St

6.15811726771

Rcv

-0.00912207144337

Rse

0.0

Rst

-0.182939328144

Rsv

0.295100482784


NDVI range @ 1km [-]

0.01

NDVI range @ 2km [-]

0.04

NDVI range @ 5km [-]

0.06

NDVI range @ 10km [-]

0.07

NDVI range @ 20km [-]

0.1


NDVI slope @ 1 km

0.000130108910844

NDVI slope @ 2 km

0.00012944195489

NDVI slope @ 5 km

0.000106571769982

NDVI slope @ 10 km

6.68581154888e-05

NDVI slope @ 20 km

3.38200472353e-05


Temporal stability analysis

+000 deg (BHR)


BHR statistics

Temporal stability [1/decade]:


abs

rel


Weighted least square:

None


Ordinary least square:

None


Probabilities that GCOS criteria is met:

Weighted least square:

None %

Ordinary least square:

None %


DHR statistics

Temporal stability [1/decade]:


abs

rel


Weighted least square:

None


Ordinary least square:

None


Probabilities that GCOS criteria is met:

Weighted least square:

None %

Ordinary least square:

None %


+057/+063 deg (BHR)


BHR statistics

Temporal stability [1/decade]:


abs

rel


Weighted least square:

None


Ordinary least square:

None


Probabilities that GCOS criteria is met:

Weighted least square:

None %

Ordinary least square:

None %


DHR statistics

Temporal stability [1/decade]:


abs

rel


Weighted least square:

None


Ordinary least square:

None


Probabilities that GCOS criteria is met:

Weighted least square:

None %

Ordinary least square:

None %


Temporal anomaly analyis

The variance of the temporal anomalies provides an additional measure about the stability of the signal AFTER removal of the mean seasonal cylce.

+000 deg


+057/+063 deg