BELMANIP_00075


Location

lon / lat [deg]: -77.8525 / 41.5882

Source network: BELMANIP


Geostationary surface albedo (GSA) data


“+000”


“+057/+063”


Landcover information (based on ESA CCI landcover data)


Landcover fractions @ 2km distance


Landcover fractions @ 20 km distance


Legend


Distance to open water bodies [km]:

13.09

Distance to urban areas [km]:

20.54


Radius: 1 km

Number of landcover classes:

2

Dominant landcover type:

61: Tree cover, broadleaved, decidous (closed > 40%)

Fraction of dominant landcover type [%]:

95.0


Radius: 2 km

Number of landcover classes:

2

Dominant landcover type:

61: Tree cover, broadleaved, decidous (closed > 40%)

Fraction of dominant landcover type [%]:

99.0


Radius: 5 km

Number of landcover classes:

3

Dominant landcover type:

61: Tree cover, broadleaved, decidous (closed > 40%)

Fraction of dominant landcover type [%]:

92.0


Radius: 10 km

Number of landcover classes:

3

Dominant landcover type:

61: Tree cover, broadleaved, decidous (closed > 40%)

Fraction of dominant landcover type [%]:

84.0


Radius: 20 km

Number of landcover classes:

3

Dominant landcover type:

61: Tree cover, broadleaved, decidous (closed > 40%)

Fraction of dominant landcover type [%]:

79.0


Disturbances


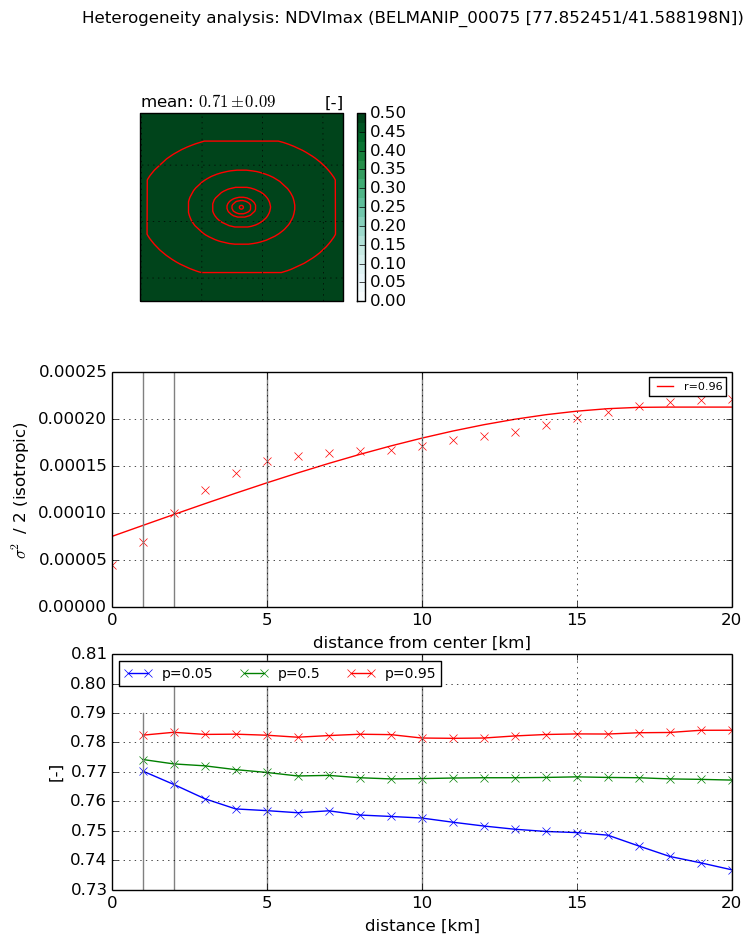
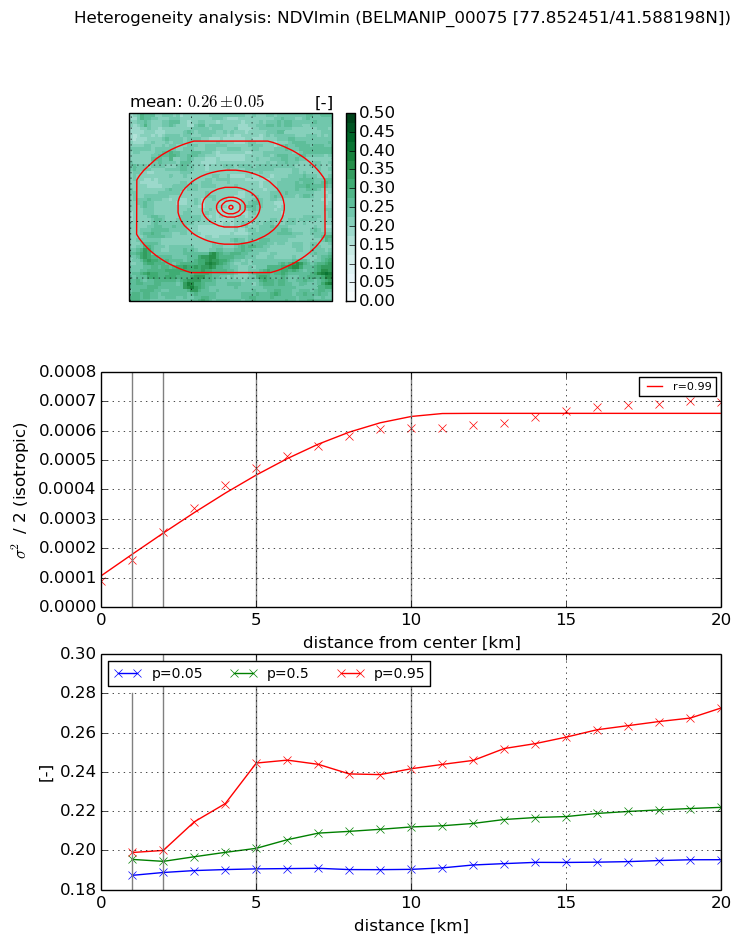
Heterogeneity analysis

The heterogeneity analysis provides information about the spatial and temporal heterogeneity of the site.

Topography


Roman et al. (2009) index


St

2.52413903667

Rcv

0.235334398441

Rse

0.0

Rst

0.520277649684

Rsv

-0.432912021436


Height range @ 1km [m]

123

Height range @ 2km [m]

148

Height range @ 5km [m]

210

Height range @ 10km [m]

-999

Height range @ 20km [m]

-999


Variance slope @ 1 km

3483

Variance slope @ 2 km

1756

Variance slope @ 5 km

429

Variance slope @ 10 km

-999

Variance slope @ 20 km

-999


NDVI (max. NDVI composite)


Roman et al. (2009) index


St

13.1389699451

Rcv

0.0548142989054

Rse

0.0

Rst

-0.00405164464803

Rsv

-0.169462457572


NDVI range @ 1km [-]

0.01

NDVI range @ 2km [-]

0.02

NDVI range @ 5km [-]

0.03

NDVI range @ 10km [-]

0.03

NDVI range @ 20km [-]

0.05


Variance slope @ 1 km

2.45476729475e-05

Variance slope @ 2 km

2.73515829326e-05

Variance slope @ 5 km

2.26511822306e-05

Variance slope @ 10 km

1.20182446077e-05

Variance slope @ 20 km

7.21748490044e-06


NDVI (min. NDVI composite)I


Roman et al. (2009) index


St

2.31371067801

Rcv

1.06591446097

Rse

0.0

Rst

-0.152588430065

Rsv

0.0781155792427


NDVI range @ 1km [-]

0.01

NDVI range @ 2km [-]

0.01

NDVI range @ 5km [-]

0.05

NDVI range @ 10km [-]

0.05

NDVI range @ 20km [-]

0.08


NDVI slope @ 1 km

7.25310036613e-05

NDVI slope @ 2 km

8.32725757678e-05

NDVI slope @ 5 km

7.86425118895e-05

NDVI slope @ 10 km

5.33114945665e-05

NDVI slope @ 20 km

2.63224839759e-05


Temporal stability analysis

+000 deg (BHR)


BHR statistics

Temporal stability [1/decade]:


abs

rel


Weighted least square:

-99999.0


Ordinary least square:

-99999.0


Probabilities that GCOS criteria is met:

Weighted least square:

-99999.0 %

Ordinary least square:

-99999.0 %


DHR statistics

Temporal stability [1/decade]:


abs

rel


Weighted least square:

-99999.0


Ordinary least square:

-99999.0


Probabilities that GCOS criteria is met:

Weighted least square:

-99999.0 %

Ordinary least square:

-99999.0 %


+057/+063 deg (BHR)


BHR statistics

Temporal stability [1/decade]:


abs

rel


Weighted least square:

None


Ordinary least square:

None


Probabilities that GCOS criteria is met:

Weighted least square:

None %

Ordinary least square:

None %


DHR statistics

Temporal stability [1/decade]:


abs

rel


Weighted least square:

None


Ordinary least square:

None


Probabilities that GCOS criteria is met:

Weighted least square:

None %

Ordinary least square:

None %


Temporal anomaly analyis

The variance of the temporal anomalies provides an additional measure about the stability of the signal AFTER removal of the mean seasonal cylce.

+000 deg


+057/+063 deg