BELMANIP_00076


Location

lon / lat [deg]: -75.9974 / 47.9138

Source network: BELMANIP


Geostationary surface albedo (GSA) data


“+000”


“+057/+063”


Landcover information (based on ESA CCI landcover data)


Landcover fractions @ 2km distance


Landcover fractions @ 20 km distance


Legend


Distance to open water bodies [km]:

1.66

Distance to urban areas [km]:

none in region


Radius: 1 km

Number of landcover classes:

4

Dominant landcover type:

70: Tree cover, needleleaved, evergreen, closed to open (>15%)

Fraction of dominant landcover type [%]:

46.0


Radius: 2 km

Number of landcover classes:

5

Dominant landcover type:

70: Tree cover, needleleaved, evergreen, closed to open (>15%)

Fraction of dominant landcover type [%]:

59.0


Radius: 5 km

Number of landcover classes:

5

Dominant landcover type:

70: Tree cover, needleleaved, evergreen, closed to open (>15%)

Fraction of dominant landcover type [%]:

60.0


Radius: 10 km

Number of landcover classes:

5

Dominant landcover type:

70: Tree cover, needleleaved, evergreen, closed to open (>15%)

Fraction of dominant landcover type [%]:

61.0


Radius: 20 km

Number of landcover classes:

5

Dominant landcover type:

70: Tree cover, needleleaved, evergreen, closed to open (>15%)

Fraction of dominant landcover type [%]:

63.0


Disturbances


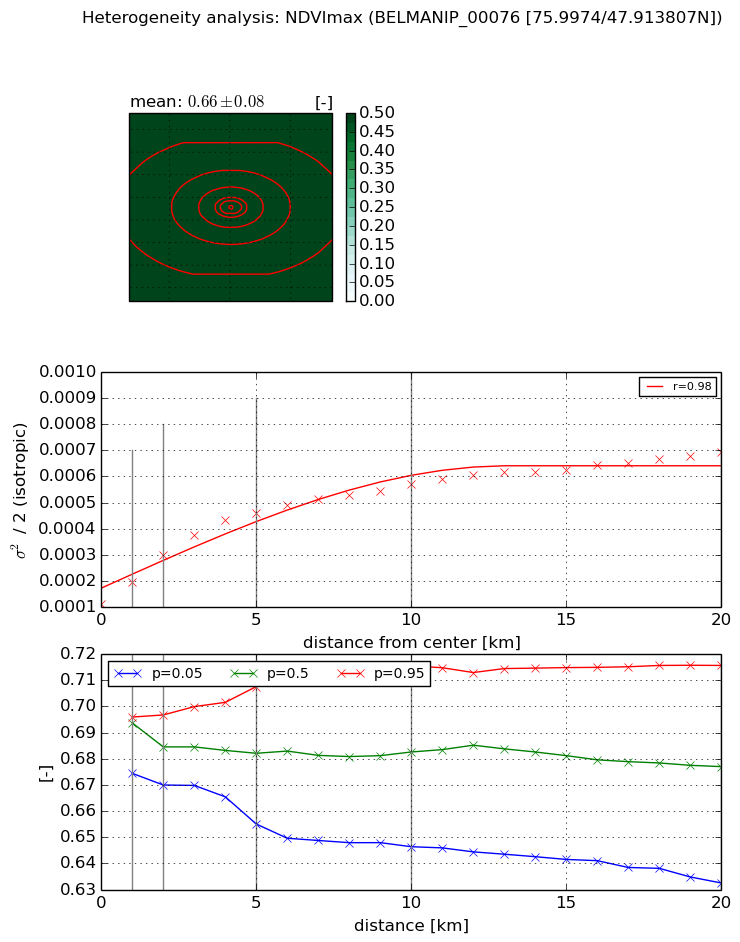
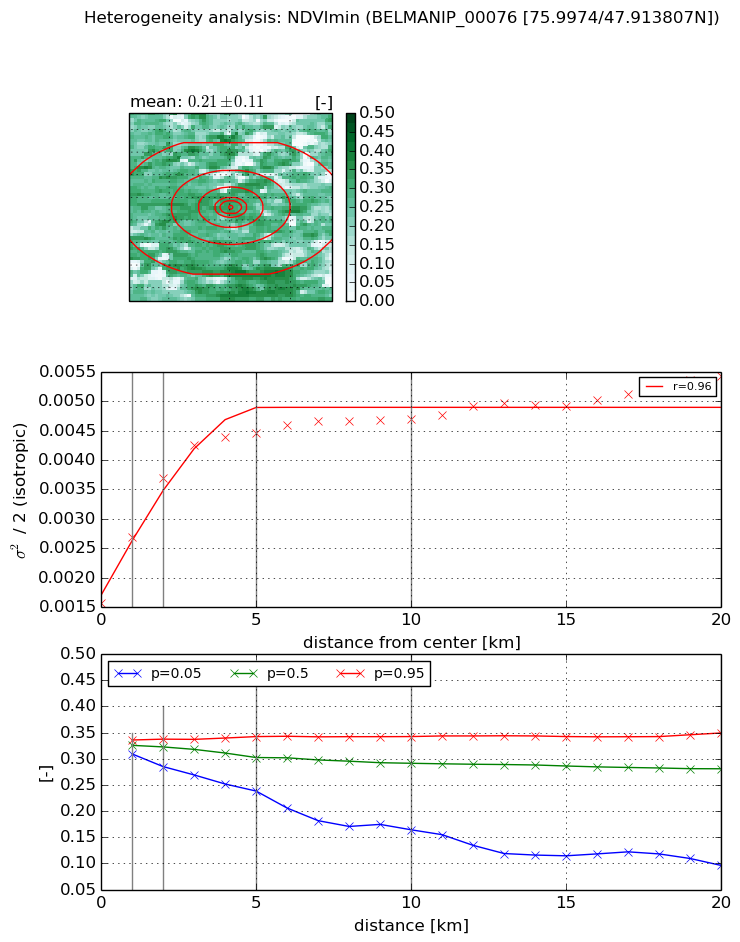
Heterogeneity analysis

The heterogeneity analysis provides information about the spatial and temporal heterogeneity of the site.

Topography


Roman et al. (2009) index


St

3.5701221526

Rcv

0.142958012653

Rse

0.0

Rst

0.0649745367009

Rsv

0.632374832794


Height range @ 1km [m]

58

Height range @ 2km [m]

57

Height range @ 5km [m]

74

Height range @ 10km [m]

-999

Height range @ 20km [m]

-999


Variance slope @ 1 km

333

Variance slope @ 2 km

166

Variance slope @ 5 km

78

Variance slope @ 10 km

-999

Variance slope @ 20 km

-999


NDVI (max. NDVI composite)


Roman et al. (2009) index


St

6.10657715118e-07

Rcv

0.590050135503

Rse

0.0

Rst

0.125253769017

Rsv

4912735.05423


NDVI range @ 1km [-]

0.02

NDVI range @ 2km [-]

0.03

NDVI range @ 5km [-]

0.05

NDVI range @ 10km [-]

0.07

NDVI range @ 20km [-]

0.08


Variance slope @ 1 km

8.56899936182e-05

Variance slope @ 2 km

9.4134442279e-05

Variance slope @ 5 km

7.18896929964e-05

Variance slope @ 10 km

4.2725223735e-05

Variance slope @ 20 km

2.35269078764e-05


NDVI (min. NDVI composite)I


Roman et al. (2009) index


St

2.17785263236

Rcv

0.69420121248

Rse

0.0

Rst

-0.0312707379067

Rsv

-0.652031722463


NDVI range @ 1km [-]

0.03

NDVI range @ 2km [-]

0.05

NDVI range @ 5km [-]

0.1

NDVI range @ 10km [-]

0.18

NDVI range @ 20km [-]

0.25


NDVI slope @ 1 km

0.00112698236835

NDVI slope @ 2 km

0.0010651201451

NDVI slope @ 5 km

0.000574732798957

NDVI slope @ 10 km

0.000249448147629

NDVI slope @ 20 km

0.000116924736238


Temporal stability analysis

+000 deg (BHR)


BHR statistics

Temporal stability [1/decade]:


abs

rel


Weighted least square:

-99999.0


Ordinary least square:

-99999.0


Probabilities that GCOS criteria is met:

Weighted least square:

-99999.0 %

Ordinary least square:

-99999.0 %


DHR statistics

Temporal stability [1/decade]:


abs

rel


Weighted least square:

-99999.0


Ordinary least square:

-99999.0


Probabilities that GCOS criteria is met:

Weighted least square:

-99999.0 %

Ordinary least square:

-99999.0 %


+057/+063 deg (BHR)


BHR statistics

Temporal stability [1/decade]:


abs

rel


Weighted least square:

None


Ordinary least square:

None


Probabilities that GCOS criteria is met:

Weighted least square:

None %

Ordinary least square:

None %


DHR statistics

Temporal stability [1/decade]:


abs

rel


Weighted least square:

None


Ordinary least square:

None


Probabilities that GCOS criteria is met:

Weighted least square:

None %

Ordinary least square:

None %


Temporal anomaly analyis

The variance of the temporal anomalies provides an additional measure about the stability of the signal AFTER removal of the mean seasonal cylce.

+000 deg


+057/+063 deg