BELMANIP_00080


Location

lon / lat [deg]: -65.4199 / 48.3358

Source network: BELMANIP


Geostationary surface albedo (GSA) data


“+000”


“+057/+063”


Landcover information (based on ESA CCI landcover data)


Landcover fractions @ 2km distance


Landcover fractions @ 20 km distance


Legend


Distance to open water bodies [km]:

9.76

Distance to urban areas [km]:

36.44


Radius: 1 km

Number of landcover classes:

4

Dominant landcover type:

62: Tree cover, broadleaved, decidous (open 15-40%)

Fraction of dominant landcover type [%]:

76.0


Radius: 2 km

Number of landcover classes:

8

Dominant landcover type:

62: Tree cover, broadleaved, decidous (open 15-40%)

Fraction of dominant landcover type [%]:

42.0


Radius: 5 km

Number of landcover classes:

8

Dominant landcover type:

71: Tree cover, needleleaved, evergreen, closed to open (>40%)

Fraction of dominant landcover type [%]:

33.0


Radius: 10 km

Number of landcover classes:

7

Dominant landcover type:

71: Tree cover, needleleaved, evergreen, closed to open (>40%)

Fraction of dominant landcover type [%]:

44.0


Radius: 20 km

Number of landcover classes:

6

Dominant landcover type:

71: Tree cover, needleleaved, evergreen, closed to open (>40%)

Fraction of dominant landcover type [%]:

33.0


Disturbances


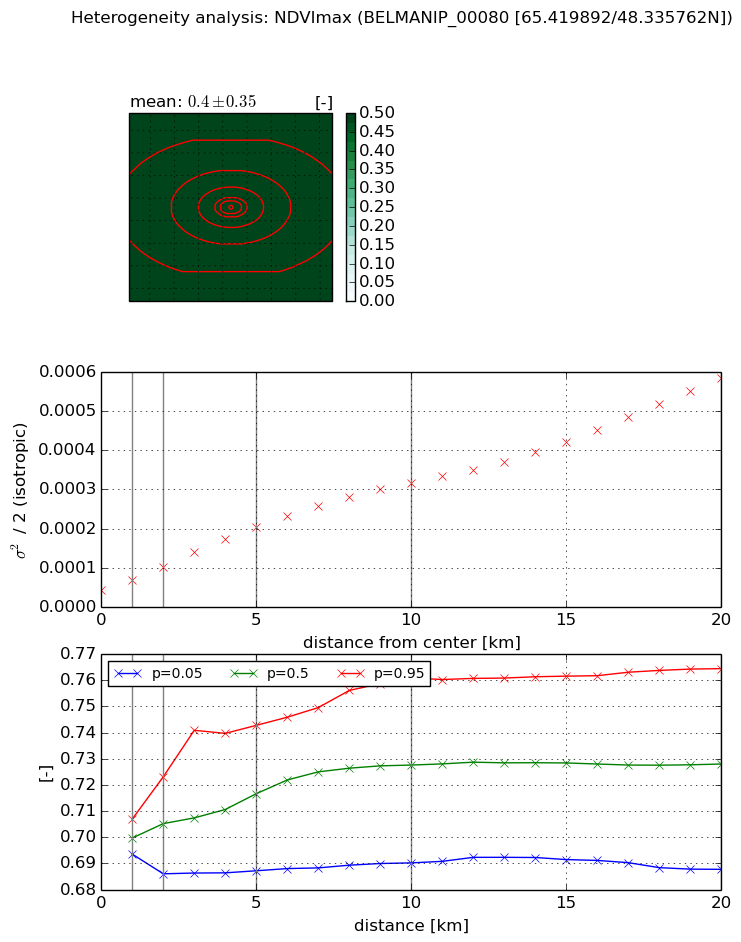
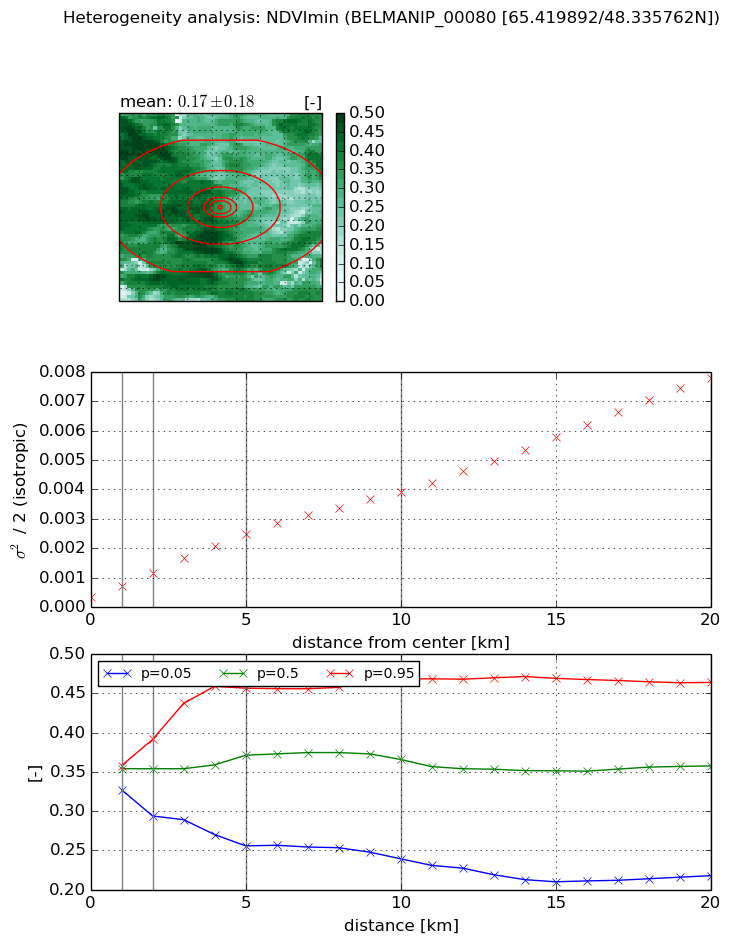
Heterogeneity analysis

The heterogeneity analysis provides information about the spatial and temporal heterogeneity of the site.

Topography


Roman et al. (2009) index


St

0.00209819519595

Rcv

1.16619251679

Rse

0.0

Rst

-0.11680076453

Rsv

1428.51724923


Height range @ 1km [m]

89

Height range @ 2km [m]

135

Height range @ 5km [m]

310

Height range @ 10km [m]

-999

Height range @ 20km [m]

-999


Variance slope @ 1 km

3990

Variance slope @ 2 km

2933

Variance slope @ 5 km

1407

Variance slope @ 10 km

-999

Variance slope @ 20 km

-999


NDVI (max. NDVI composite)


Roman et al. (2009) index


St

1.36583355667e-05

Rcv

0.0754066094594

Rse

0.0

Rst

0.0257168439393

Rsv

219645.988646


NDVI range @ 1km [-]

0.01

NDVI range @ 2km [-]

0.04

NDVI range @ 5km [-]

0.06

NDVI range @ 10km [-]

0.07

NDVI range @ 20km [-]

0.08


Variance slope @ 1 km

2.70590292657e-05

Variance slope @ 2 km

3.02511232968e-05

Variance slope @ 5 km

3.2881699982e-05

Variance slope @ 10 km

2.83584548224e-05

Variance slope @ 20 km

2.51884442697e-05


NDVI (min. NDVI composite)I


Roman et al. (2009) index


St

7.29726113461

Rcv

0.287261437349

Rse

0.0

Rst

-3.35495745564e-08

Rsv

0.123851677536


NDVI range @ 1km [-]

0.03

NDVI range @ 2km [-]

0.1

NDVI range @ 5km [-]

0.2

NDVI range @ 10km [-]

0.23

NDVI range @ 20km [-]

0.25


NDVI slope @ 1 km

0.00035669626331

NDVI slope @ 2 km

0.000407120964968

NDVI slope @ 5 km

0.000439259592932

NDVI slope @ 10 km

0.00036306349946

NDVI slope @ 20 km

0.000359670069183


Temporal stability analysis

+000 deg (BHR)


BHR statistics

Temporal stability [1/decade]:


abs

rel


Weighted least square:

-99999.0


Ordinary least square:

-99999.0


Probabilities that GCOS criteria is met:

Weighted least square:

-99999.0 %

Ordinary least square:

-99999.0 %


DHR statistics

Temporal stability [1/decade]:


abs

rel


Weighted least square:

-99999.0


Ordinary least square:

-99999.0


Probabilities that GCOS criteria is met:

Weighted least square:

-99999.0 %

Ordinary least square:

-99999.0 %


+057/+063 deg (BHR)


BHR statistics

Temporal stability [1/decade]:


abs

rel


Weighted least square:

None


Ordinary least square:

None


Probabilities that GCOS criteria is met:

Weighted least square:

None %

Ordinary least square:

None %


DHR statistics

Temporal stability [1/decade]:


abs

rel


Weighted least square:

None


Ordinary least square:

None


Probabilities that GCOS criteria is met:

Weighted least square:

None %

Ordinary least square:

None %


Temporal anomaly analyis

The variance of the temporal anomalies provides an additional measure about the stability of the signal AFTER removal of the mean seasonal cylce.

+000 deg


+057/+063 deg