BELMANIP_00103


Location

lon / lat [deg]: -157.6845 / 57.1596

Source network: BELMANIP


Geostationary surface albedo (GSA) data


“+000”


“+057/+063”


Landcover information (based on ESA CCI landcover data)


Landcover fractions @ 2km distance


Landcover fractions @ 20 km distance


Legend


Distance to open water bodies [km]:

8.89

Distance to urban areas [km]:

none in region


Radius: 1 km

Number of landcover classes:

5

Dominant landcover type:

120: Shrubland

Fraction of dominant landcover type [%]:

92.0


Radius: 2 km

Number of landcover classes:

5

Dominant landcover type:

120: Shrubland

Fraction of dominant landcover type [%]:

81.0


Radius: 5 km

Number of landcover classes:

6

Dominant landcover type:

120: Shrubland

Fraction of dominant landcover type [%]:

73.0


Radius: 10 km

Number of landcover classes:

7

Dominant landcover type:

120: Shrubland

Fraction of dominant landcover type [%]:

62.0


Radius: 20 km

Number of landcover classes:

7

Dominant landcover type:

120: Shrubland

Fraction of dominant landcover type [%]:

44.0


Disturbances


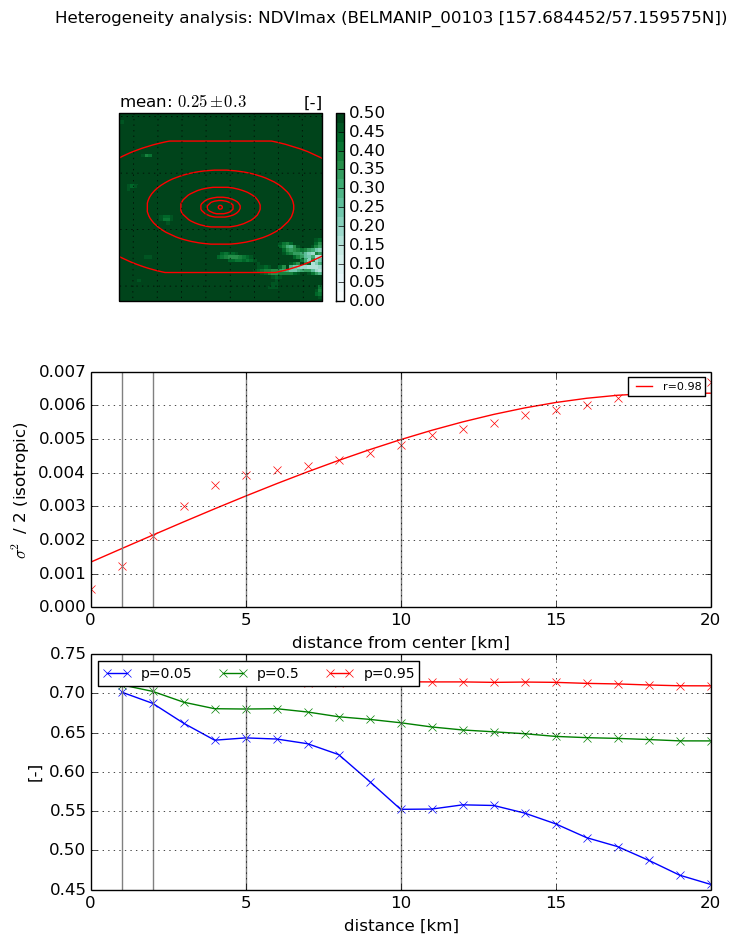
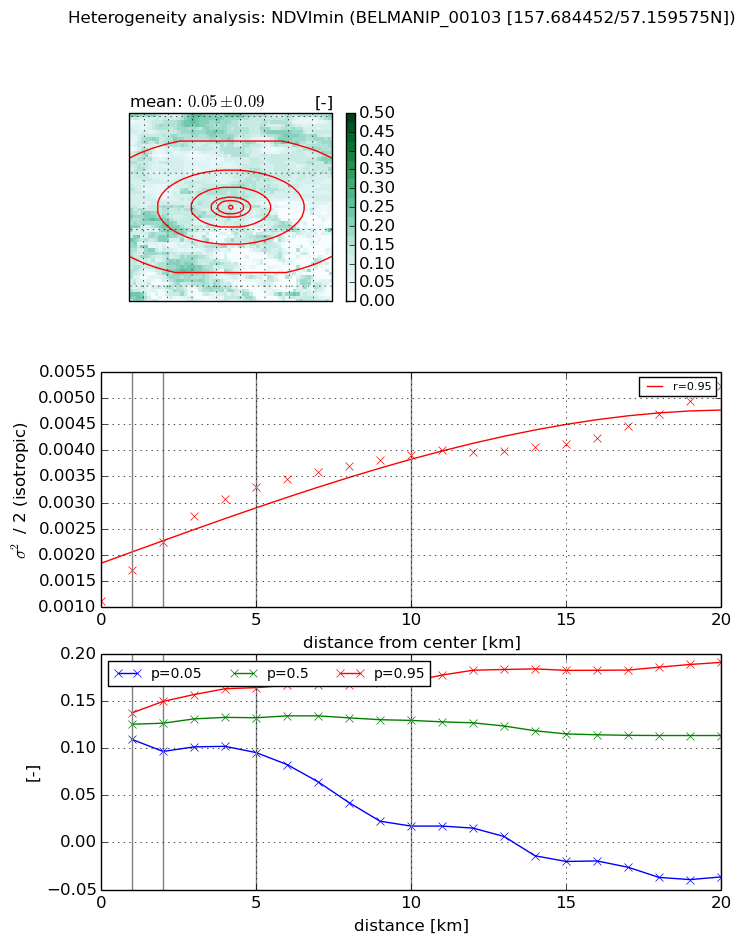
Heterogeneity analysis

The heterogeneity analysis provides information about the spatial and temporal heterogeneity of the site.

Topography


Roman et al. (2009) index


St

1.35170382539

Rcv

1.21996051817

Rse

0.0

Rst

-7.14945904563e-05

Rsv

-0.999389093875


Height range @ 1km [m]

32

Height range @ 2km [m]

54

Height range @ 5km [m]

179

Height range @ 10km [m]

-999

Height range @ 20km [m]

-999


Variance slope @ 1 km

1660

Variance slope @ 2 km

1992

Variance slope @ 5 km

1265

Variance slope @ 10 km

-999

Variance slope @ 20 km

-999


NDVI (max. NDVI composite)


Roman et al. (2009) index


St

13.6955175381

Rcv

0.0522382351326

Rse

0.0

Rst

-0.0314506375228

Rsv

0.135360899772


NDVI range @ 1km [-]

0.02

NDVI range @ 2km [-]

0.03

NDVI range @ 5km [-]

0.07

NDVI range @ 10km [-]

0.16

NDVI range @ 20km [-]

0.25


Variance slope @ 1 km

0.000703254823955

Variance slope @ 2 km

0.000798716434389

Variance slope @ 5 km

0.000716885945838

Variance slope @ 10 km

0.000404263873623

Variance slope @ 20 km

0.000263698539434


NDVI (min. NDVI composite)I


Roman et al. (2009) index


St

1.88073538858

Rcv

0.339667049545

Rse

0.0

Rst

-0.25545410156

Rsv

-0.99999957572


NDVI range @ 1km [-]

0.03

NDVI range @ 2km [-]

0.05

NDVI range @ 5km [-]

0.07

NDVI range @ 10km [-]

0.15

NDVI range @ 20km [-]

0.23


NDVI slope @ 1 km

0.000592197943347

NDVI slope @ 2 km

0.000570254500233

NDVI slope @ 5 km

0.000443840473368

NDVI slope @ 10 km

0.000262608829433

NDVI slope @ 20 km

0.000152458369078


Temporal stability analysis

+000 deg (BHR)


BHR statistics

Temporal stability [1/decade]:


abs

rel


Weighted least square:

None


Ordinary least square:

None


Probabilities that GCOS criteria is met:

Weighted least square:

None %

Ordinary least square:

None %


DHR statistics

Temporal stability [1/decade]:


abs

rel


Weighted least square:

None


Ordinary least square:

None


Probabilities that GCOS criteria is met:

Weighted least square:

None %

Ordinary least square:

None %


+057/+063 deg (BHR)


BHR statistics

Temporal stability [1/decade]:


abs

rel


Weighted least square:

None


Ordinary least square:

None


Probabilities that GCOS criteria is met:

Weighted least square:

None %

Ordinary least square:

None %


DHR statistics

Temporal stability [1/decade]:


abs

rel


Weighted least square:

None


Ordinary least square:

None


Probabilities that GCOS criteria is met:

Weighted least square:

None %

Ordinary least square:

None %


Temporal anomaly analyis

The variance of the temporal anomalies provides an additional measure about the stability of the signal AFTER removal of the mean seasonal cylce.

+000 deg


+057/+063 deg