BELMANIP_00108


Location

lon / lat [deg]: -127.6205 / 61.0029

Source network: BELMANIP


Geostationary surface albedo (GSA) data


“+000”


“+057/+063”


Landcover information (based on ESA CCI landcover data)


Landcover fractions @ 2km distance


Landcover fractions @ 20 km distance


Legend


Distance to open water bodies [km]:

8.18

Distance to urban areas [km]:

none in region


Radius: 1 km

Number of landcover classes:

1

Dominant landcover type:

70: Tree cover, needleleaved, evergreen, closed to open (>15%)

Fraction of dominant landcover type [%]:

100.0


Radius: 2 km

Number of landcover classes:

1

Dominant landcover type:

70: Tree cover, needleleaved, evergreen, closed to open (>15%)

Fraction of dominant landcover type [%]:

100.0


Radius: 5 km

Number of landcover classes:

1

Dominant landcover type:

70: Tree cover, needleleaved, evergreen, closed to open (>15%)

Fraction of dominant landcover type [%]:

100.0


Radius: 10 km

Number of landcover classes:

2

Dominant landcover type:

70: Tree cover, needleleaved, evergreen, closed to open (>15%)

Fraction of dominant landcover type [%]:

97.0


Radius: 20 km

Number of landcover classes:

3

Dominant landcover type:

70: Tree cover, needleleaved, evergreen, closed to open (>15%)

Fraction of dominant landcover type [%]:

87.0


Disturbances


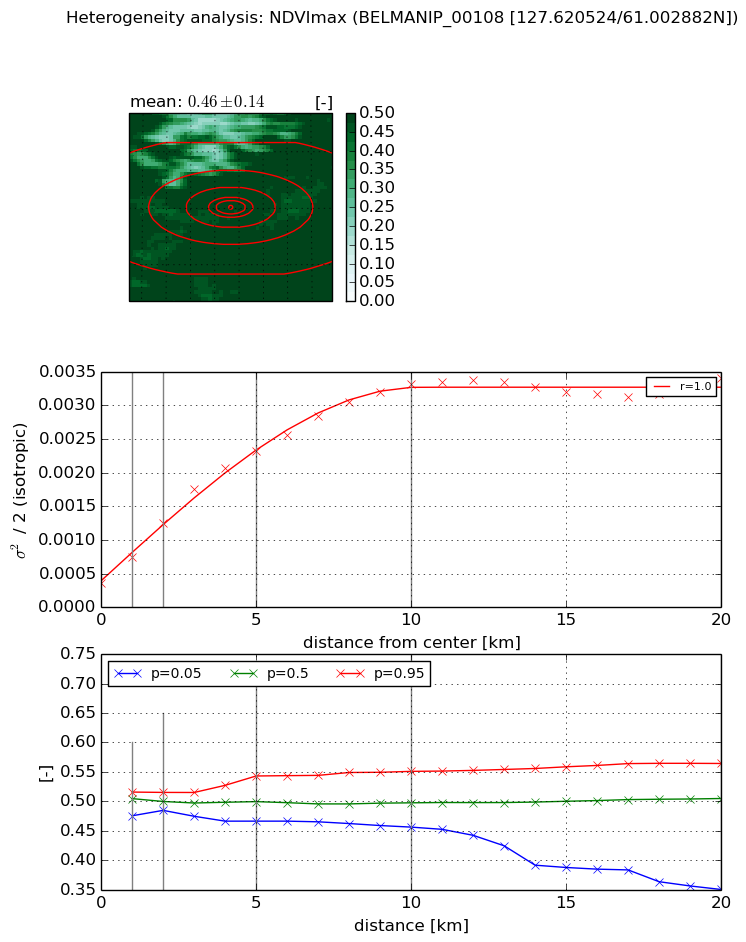
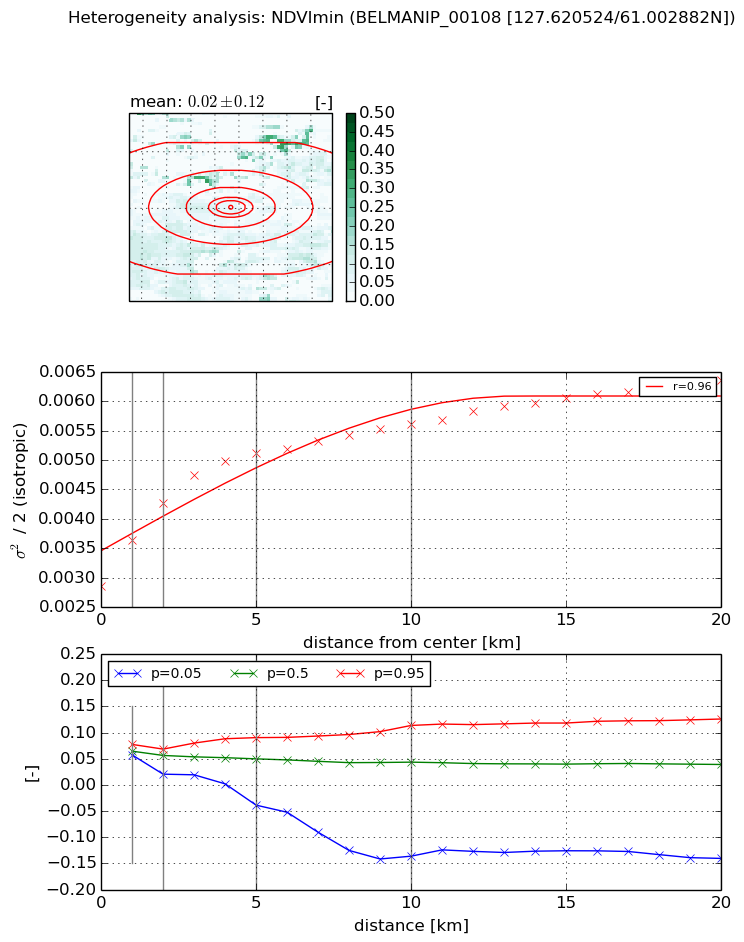
Heterogeneity analysis

The heterogeneity analysis provides information about the spatial and temporal heterogeneity of the site.

Topography


Roman et al. (2009) index


St

3.06054166915

Rcv

0.71820924436

Rse

0.0

Rst

-3.43523287756e-07

Rsv

-0.262009054535


Height range @ 1km [m]

52

Height range @ 2km [m]

115

Height range @ 5km [m]

252

Height range @ 10km [m]

-999

Height range @ 20km [m]

-999


Variance slope @ 1 km

639

Variance slope @ 2 km

979

Variance slope @ 5 km

1655

Variance slope @ 10 km

-999

Variance slope @ 20 km

-999


NDVI (max. NDVI composite)


Roman et al. (2009) index


St

1.61022155771

Rcv

0.788435009689

Rse

0.0

Rst

-0.0746628040632

Rsv

-0.999999836152


NDVI range @ 1km [-]

0.04

NDVI range @ 2km [-]

0.03

NDVI range @ 5km [-]

0.08

NDVI range @ 10km [-]

0.09

NDVI range @ 20km [-]

0.21


Variance slope @ 1 km

0.000395355213369

Variance slope @ 2 km

0.000445522363692

Variance slope @ 5 km

0.000409320316561

Variance slope @ 10 km

0.000297305933843

Variance slope @ 20 km

0.000122822644024


NDVI (min. NDVI composite)I


Roman et al. (2009) index


St

1.85422339117e-07

Rcv

2.42995211036

Rse

0.0

Rst

-0.0138921447829

Rsv

16179277.8645


NDVI range @ 1km [-]

0.02

NDVI range @ 2km [-]

0.05

NDVI range @ 5km [-]

0.13

NDVI range @ 10km [-]

0.25

NDVI range @ 20km [-]

0.27


NDVI slope @ 1 km

0.000781648641968

NDVI slope @ 2 km

0.000712698072247

NDVI slope @ 5 km

0.000453276916467

NDVI slope @ 10 km

0.000238455731271

NDVI slope @ 20 km

0.000133216665053


Temporal stability analysis

+000 deg (BHR)


BHR statistics

Temporal stability [1/decade]:


abs

rel


Weighted least square:

None


Ordinary least square:

None


Probabilities that GCOS criteria is met:

Weighted least square:

None %

Ordinary least square:

None %


DHR statistics

Temporal stability [1/decade]:


abs

rel


Weighted least square:

None


Ordinary least square:

None


Probabilities that GCOS criteria is met:

Weighted least square:

None %

Ordinary least square:

None %


+057/+063 deg (BHR)


BHR statistics

Temporal stability [1/decade]:


abs

rel


Weighted least square:

None


Ordinary least square:

None


Probabilities that GCOS criteria is met:

Weighted least square:

None %

Ordinary least square:

None %


DHR statistics

Temporal stability [1/decade]:


abs

rel


Weighted least square:

None


Ordinary least square:

None


Probabilities that GCOS criteria is met:

Weighted least square:

None %

Ordinary least square:

None %


Temporal anomaly analyis

The variance of the temporal anomalies provides an additional measure about the stability of the signal AFTER removal of the mean seasonal cylce.

+000 deg


+057/+063 deg