BELMANIP_00111


Location

lon / lat [deg]: -120.6286 / 63.285

Source network: BELMANIP


Geostationary surface albedo (GSA) data


“+000”


“+057/+063”


Landcover information (based on ESA CCI landcover data)


Landcover fractions @ 2km distance


Landcover fractions @ 20 km distance


Legend


Distance to open water bodies [km]:

10.62

Distance to urban areas [km]:

none in region


Radius: 1 km

Number of landcover classes:

4

Dominant landcover type:

130: grassland

Fraction of dominant landcover type [%]:

53.0


Radius: 2 km

Number of landcover classes:

5

Dominant landcover type:

130: grassland

Fraction of dominant landcover type [%]:

53.0


Radius: 5 km

Number of landcover classes:

5

Dominant landcover type:

130: grassland

Fraction of dominant landcover type [%]:

51.0


Radius: 10 km

Number of landcover classes:

6

Dominant landcover type:

130: grassland

Fraction of dominant landcover type [%]:

44.0


Radius: 20 km

Number of landcover classes:

6

Dominant landcover type:

70: Tree cover, needleleaved, evergreen, closed to open (>15%)

Fraction of dominant landcover type [%]:

33.0


Disturbances


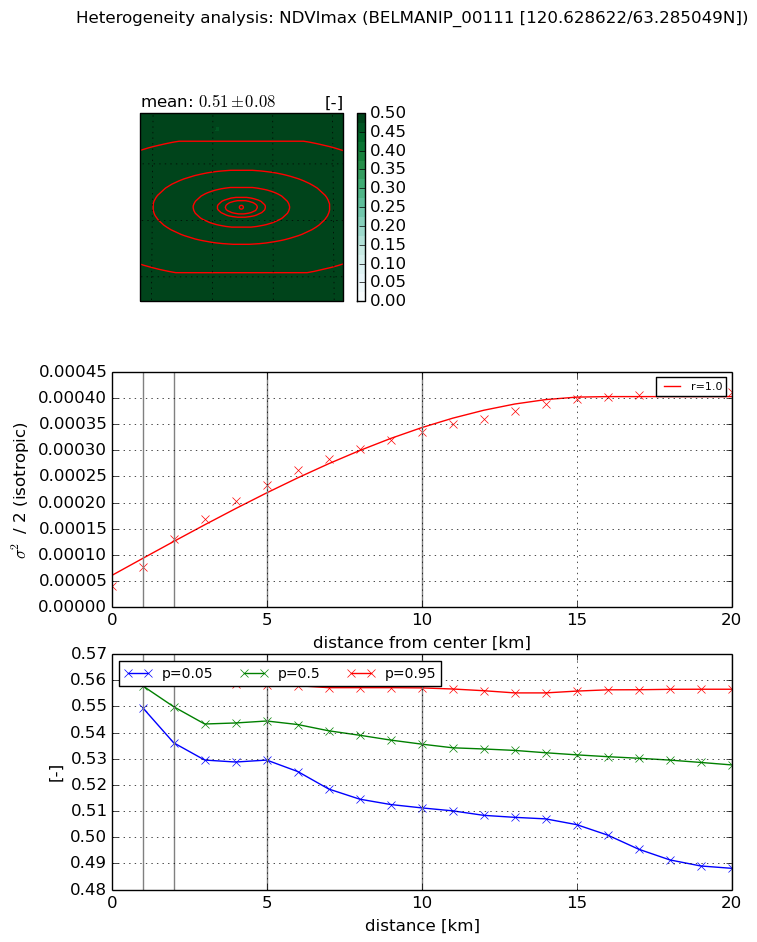
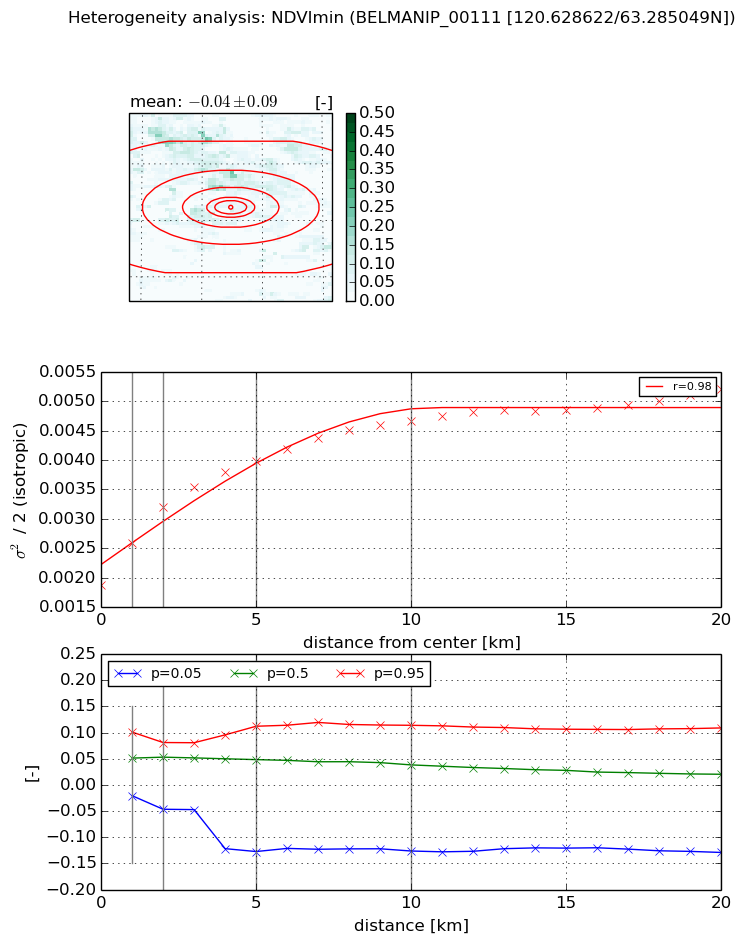
Heterogeneity analysis

The heterogeneity analysis provides information about the spatial and temporal heterogeneity of the site.

Topography


Roman et al. (2009) index


St

2.29551861033

Rcv

0.576758717366

Rse

0.0

Rst

-1.43458166555e-05

Rsv

-0.730121155187


Height range @ 1km [m]

13

Height range @ 2km [m]

21

Height range @ 5km [m]

55

Height range @ 10km [m]

-999

Height range @ 20km [m]

-999


Variance slope @ 1 km

21

Variance slope @ 2 km

34

Variance slope @ 5 km

65

Variance slope @ 10 km

-999

Variance slope @ 20 km

-999


NDVI (max. NDVI composite)


Roman et al. (2009) index


St

10.7357423242

Rcv

-0.1409782173

Rse

0.0

Rst

0.0304315068911

Rsv

-0.108030663759


NDVI range @ 1km [-]

0.01

NDVI range @ 2km [-]

0.03

NDVI range @ 5km [-]

0.03

NDVI range @ 10km [-]

0.05

NDVI range @ 20km [-]

0.07


Variance slope @ 1 km

3.70458696844e-05

Variance slope @ 2 km

4.54524452239e-05

Variance slope @ 5 km

3.97533439501e-05

Variance slope @ 10 km

2.95774967648e-05

Variance slope @ 20 km

1.76147545787e-05


NDVI (min. NDVI composite)I


Roman et al. (2009) index


St

0.514462248319

Rcv

1.11025715075

Rse

0.0

Rst

-0.500671959693

Rsv

4.22040255636


NDVI range @ 1km [-]

0.12

NDVI range @ 2km [-]

0.13

NDVI range @ 5km [-]

0.24

NDVI range @ 10km [-]

0.24

NDVI range @ 20km [-]

0.24


NDVI slope @ 1 km

0.000712982789895

NDVI slope @ 2 km

0.000662965232868

NDVI slope @ 5 km

0.000413679164033

NDVI slope @ 10 km

0.000254543212351

NDVI slope @ 20 km

0.000124693626708


Temporal stability analysis

+000 deg (BHR)


BHR statistics

Temporal stability [1/decade]:


abs

rel


Weighted least square:

None


Ordinary least square:

None


Probabilities that GCOS criteria is met:

Weighted least square:

None %

Ordinary least square:

None %


DHR statistics

Temporal stability [1/decade]:


abs

rel


Weighted least square:

None


Ordinary least square:

None


Probabilities that GCOS criteria is met:

Weighted least square:

None %

Ordinary least square:

None %


+057/+063 deg (BHR)


BHR statistics

Temporal stability [1/decade]:


abs

rel


Weighted least square:

None


Ordinary least square:

None


Probabilities that GCOS criteria is met:

Weighted least square:

None %

Ordinary least square:

None %


DHR statistics

Temporal stability [1/decade]:


abs

rel


Weighted least square:

None


Ordinary least square:

None


Probabilities that GCOS criteria is met:

Weighted least square:

None %

Ordinary least square:

None %


Temporal anomaly analyis

The variance of the temporal anomalies provides an additional measure about the stability of the signal AFTER removal of the mean seasonal cylce.

+000 deg


+057/+063 deg