BELMANIP_00148


Location

lon / lat [deg]: 30.8569 / -6.9034

Source network: BELMANIP


Geostationary surface albedo (GSA) data


“+000”


“+057/+063”


Landcover information (based on ESA CCI landcover data)


Landcover fractions @ 2km distance


Landcover fractions @ 20 km distance


Legend


Distance to open water bodies [km]:

30.76

Distance to urban areas [km]:

46.7


Radius: 1 km

Number of landcover classes:

2

Dominant landcover type:

120: Shrubland

Fraction of dominant landcover type [%]:

73.0


Radius: 2 km

Number of landcover classes:

2

Dominant landcover type:

120: Shrubland

Fraction of dominant landcover type [%]:

79.0


Radius: 5 km

Number of landcover classes:

4

Dominant landcover type:

120: Shrubland

Fraction of dominant landcover type [%]:

68.0


Radius: 10 km

Number of landcover classes:

6

Dominant landcover type:

120: Shrubland

Fraction of dominant landcover type [%]:

49.0


Radius: 20 km

Number of landcover classes:

7

Dominant landcover type:

120: Shrubland

Fraction of dominant landcover type [%]:

35.0


Disturbances


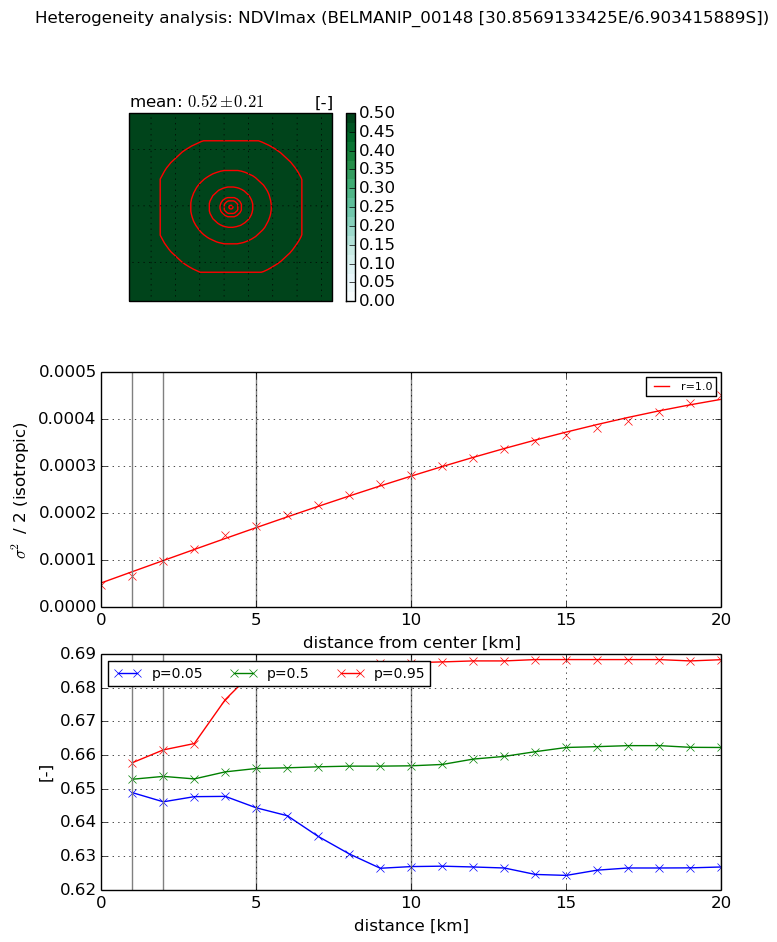
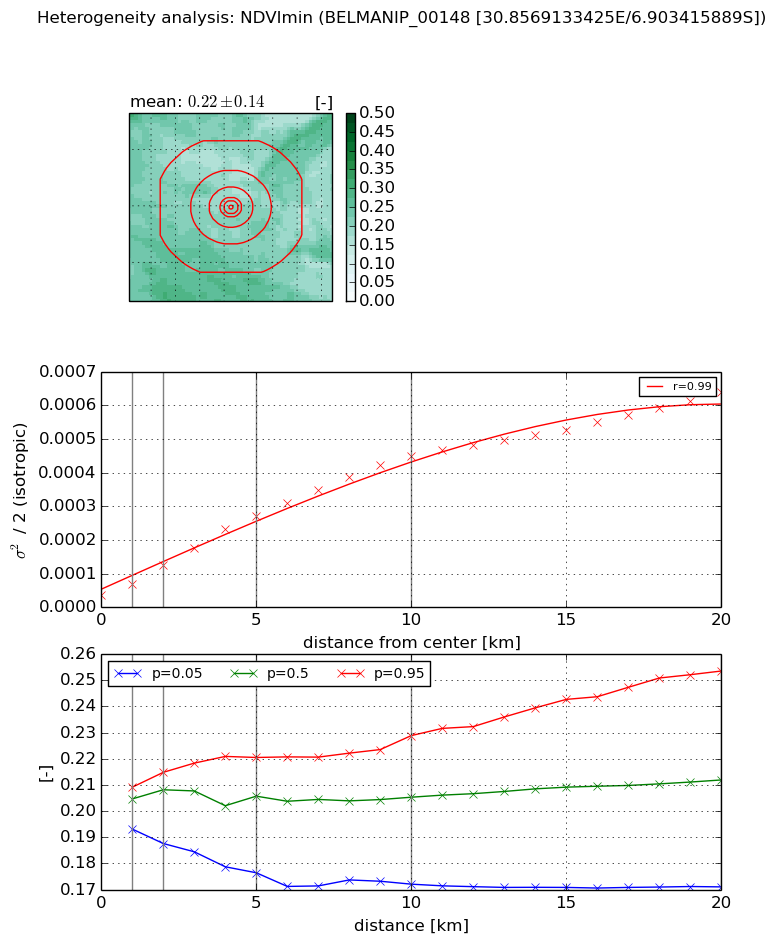
Heterogeneity analysis

The heterogeneity analysis provides information about the spatial and temporal heterogeneity of the site.

Topography


Roman et al. (2009) index


St

2.16879007008

Rcv

0.383255918911

Rse

0.0

Rst

-3.82641488683e-06

Rsv

-1.0


Height range @ 1km [m]

30

Height range @ 2km [m]

48

Height range @ 5km [m]

100

Height range @ 10km [m]

-999

Height range @ 20km [m]

-999


Variance slope @ 1 km

158

Variance slope @ 2 km

178

Variance slope @ 5 km

220

Variance slope @ 10 km

-999

Variance slope @ 20 km

-999


NDVI (max. NDVI composite)


Roman et al. (2009) index


St

1.28541984971

Rcv

0.907577245895

Rse

0.0

Rst

-0.426290773729

Rsv

-0.999999782922


NDVI range @ 1km [-]

0.01

NDVI range @ 2km [-]

0.02

NDVI range @ 5km [-]

0.04

NDVI range @ 10km [-]

0.06

NDVI range @ 20km [-]

0.06


Variance slope @ 1 km

2.0340421928e-05

Variance slope @ 2 km

2.59613509116e-05

Variance slope @ 5 km

2.61992579052e-05

Variance slope @ 10 km

2.35895317074e-05

Variance slope @ 20 km

1.98669369299e-05


NDVI (min. NDVI composite)I


Roman et al. (2009) index


St

1.47512002144e-07

Rcv

0.301510800212

Rse

0.0

Rst

0.159696285443

Rsv

20337327.7317


NDVI range @ 1km [-]

0.02

NDVI range @ 2km [-]

0.03

NDVI range @ 5km [-]

0.04

NDVI range @ 10km [-]

0.06

NDVI range @ 20km [-]

0.08


NDVI slope @ 1 km

3.29911278663e-05

NDVI slope @ 2 km

4.47508841059e-05

NDVI slope @ 5 km

4.8989574361e-05

NDVI slope @ 10 km

4.2816575785e-05

NDVI slope @ 20 km

2.87209378624e-05


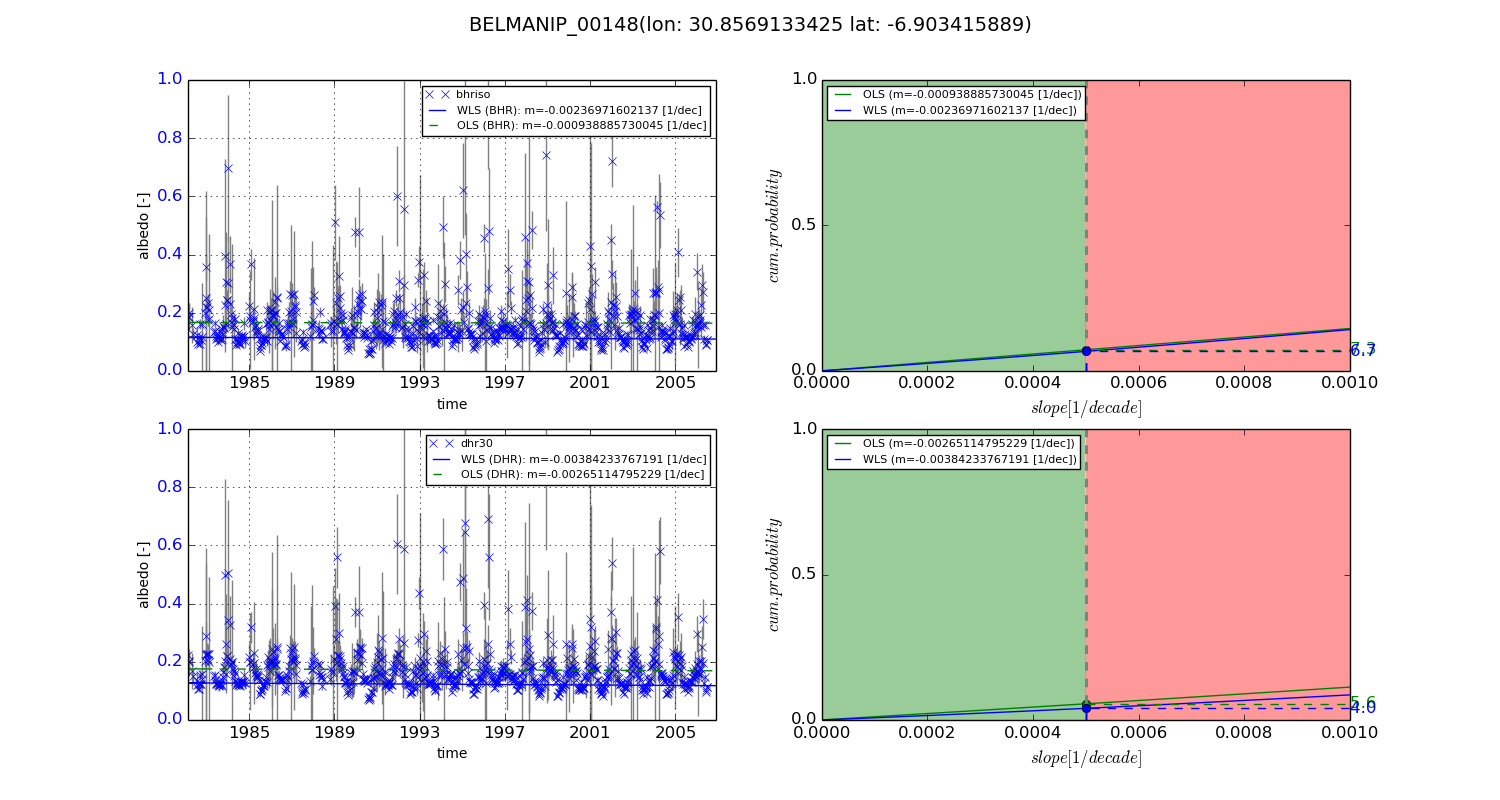
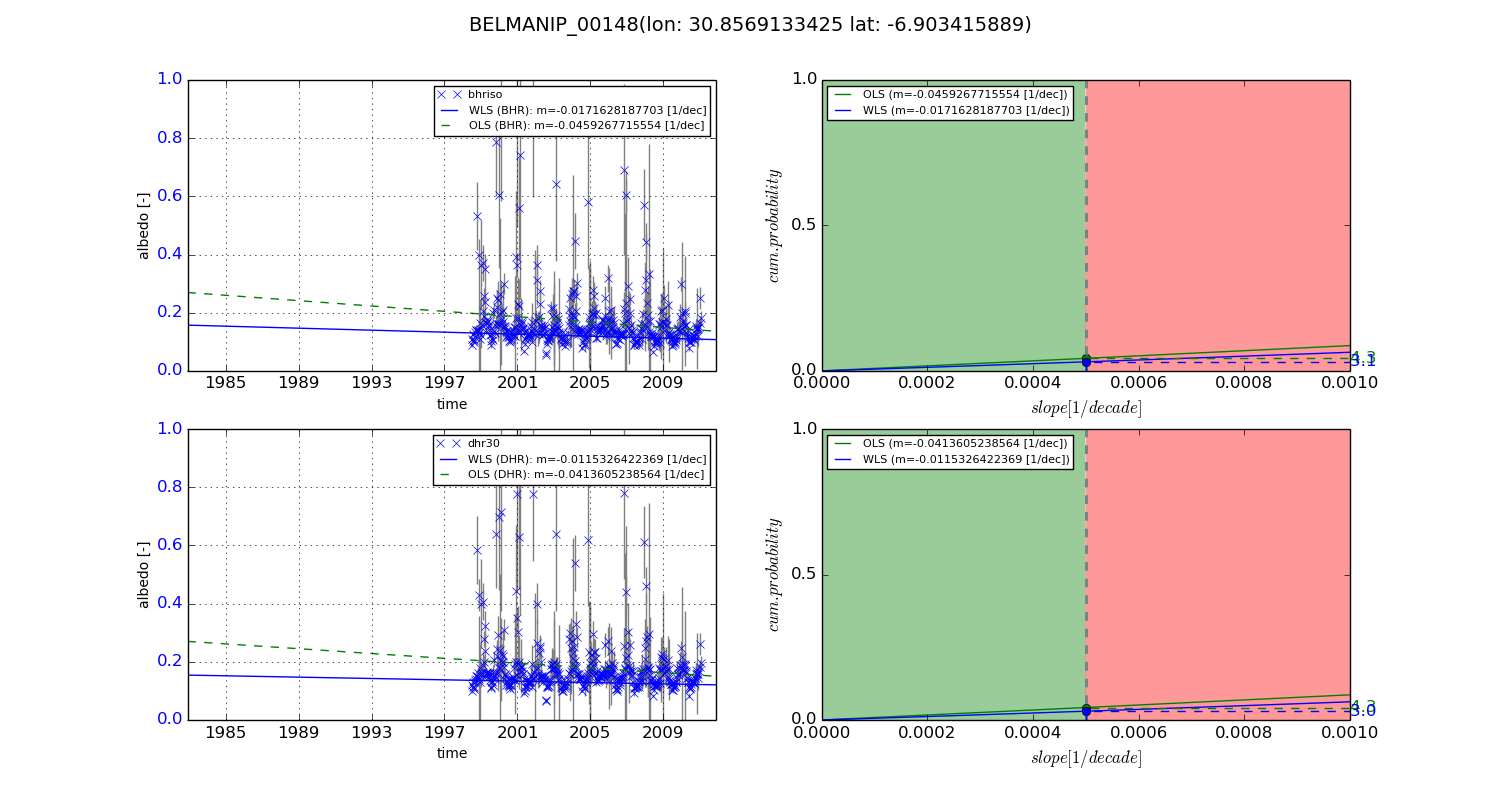
Temporal stability analysis

+000 deg (BHR)


BHR statistics

Temporal stability [1/decade]:


abs

rel


Weighted least square:

-0.00236971602137


Ordinary least square:

-0.000938885730045


Probabilities that GCOS criteria is met:

Weighted least square:

6.7 %

Ordinary least square:

7.3 %


DHR statistics

Temporal stability [1/decade]:


abs

rel


Weighted least square:

-0.00384233767191


Ordinary least square:

-0.00265114795229


Probabilities that GCOS criteria is met:

Weighted least square:

4.0 %

Ordinary least square:

5.6 %


+057/+063 deg (BHR)


BHR statistics

Temporal stability [1/decade]:


abs

rel


Weighted least square:

-0.0171628187703


Ordinary least square:

-0.0459267715554


Probabilities that GCOS criteria is met:

Weighted least square:

3.1 %

Ordinary least square:

4.3 %


DHR statistics

Temporal stability [1/decade]:


abs

rel


Weighted least square:

-0.0115326422369


Ordinary least square:

-0.0413605238564


Probabilities that GCOS criteria is met:

Weighted least square:

3.0 %

Ordinary least square:

4.3 %


Temporal anomaly analyis

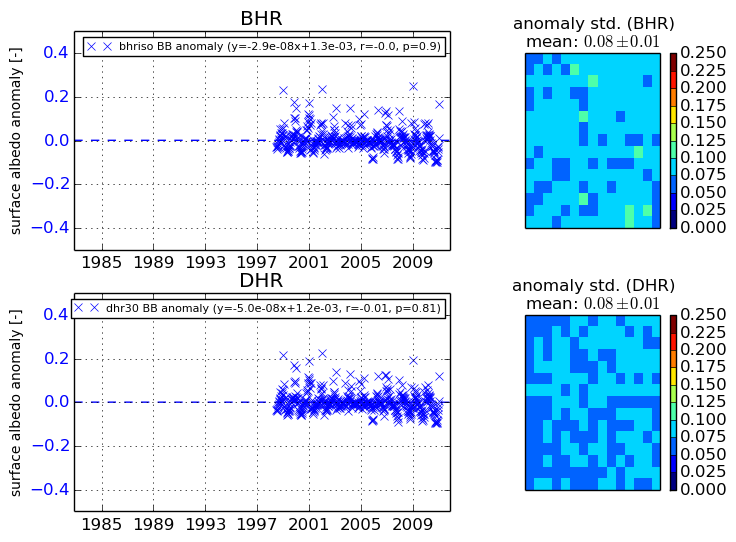
The variance of the temporal anomalies provides an additional measure about the stability of the signal AFTER removal of the mean seasonal cylce.
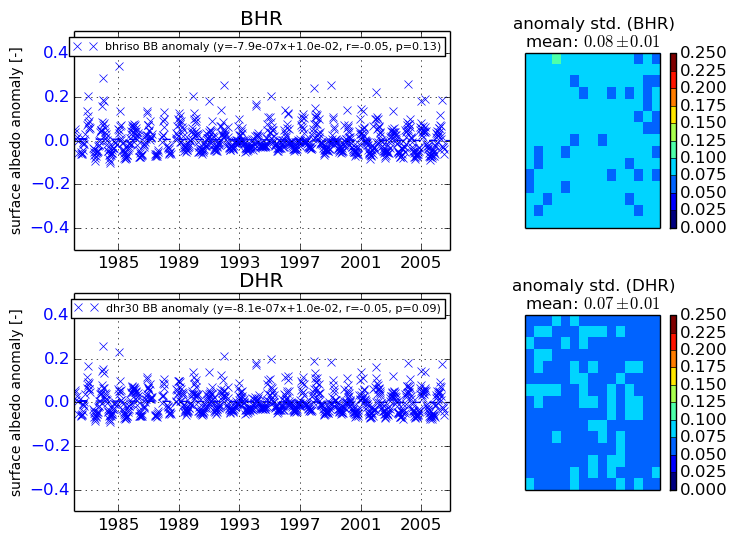
+000 deg


+057/+063 deg