BELMANIP_00164


Location

lon / lat [deg]: 25.6144 / 9.4171

Source network: BELMANIP


Geostationary surface albedo (GSA) data


“+000”


“+057/+063”


Landcover information (based on ESA CCI landcover data)


Landcover fractions @ 2km distance


Landcover fractions @ 20 km distance


Legend


Distance to open water bodies [km]:

none in region

Distance to urban areas [km]:

none in region


Radius: 1 km

Number of landcover classes:

2

Dominant landcover type:

62: Tree cover, broadleaved, decidous (open 15-40%)

Fraction of dominant landcover type [%]:

91.0


Radius: 2 km

Number of landcover classes:

2

Dominant landcover type:

62: Tree cover, broadleaved, decidous (open 15-40%)

Fraction of dominant landcover type [%]:

95.0


Radius: 5 km

Number of landcover classes:

2

Dominant landcover type:

62: Tree cover, broadleaved, decidous (open 15-40%)

Fraction of dominant landcover type [%]:

91.0


Radius: 10 km

Number of landcover classes:

2

Dominant landcover type:

62: Tree cover, broadleaved, decidous (open 15-40%)

Fraction of dominant landcover type [%]:

88.0


Radius: 20 km

Number of landcover classes:

2

Dominant landcover type:

62: Tree cover, broadleaved, decidous (open 15-40%)

Fraction of dominant landcover type [%]:

81.0


Disturbances


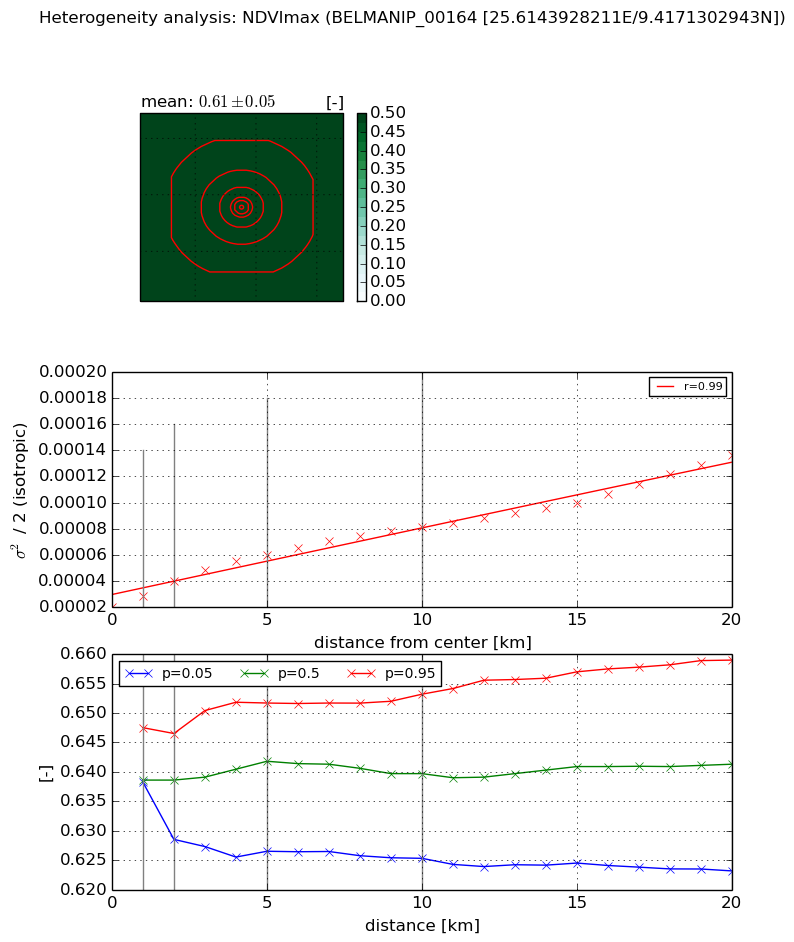
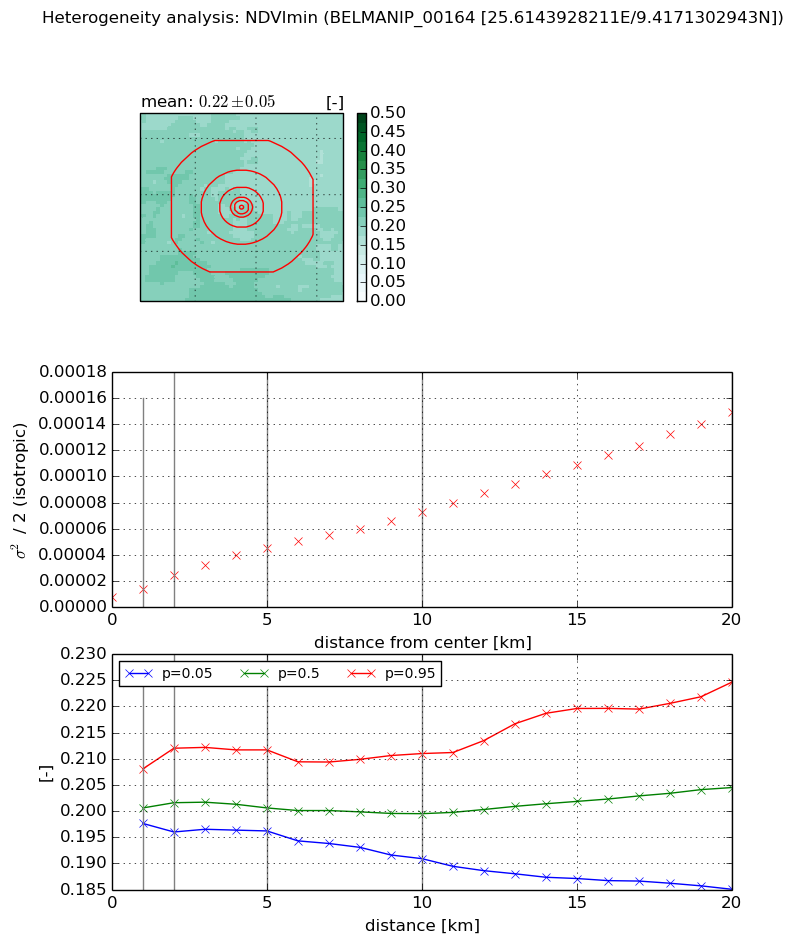
Heterogeneity analysis

The heterogeneity analysis provides information about the spatial and temporal heterogeneity of the site.

Topography


Roman et al. (2009) index


St

0.00421292066863

Rcv

0.256469468493

Rse

0.0

Rst

1.83037182543e-05

Rsv

711.838573105


Height range @ 1km [m]

12

Height range @ 2km [m]

21

Height range @ 5km [m]

35

Height range @ 10km [m]

-999

Height range @ 20km [m]

-999


Variance slope @ 1 km

13

Variance slope @ 2 km

19

Variance slope @ 5 km

26

Variance slope @ 10 km

-999

Variance slope @ 20 km

-999


NDVI (max. NDVI composite)


Roman et al. (2009) index


St

2.88646151833

Rcv

0.0655855566681

Rse

0.0

Rst

-0.336340393066

Rsv

0.637408883226


NDVI range @ 1km [-]

0.01

NDVI range @ 2km [-]

0.02

NDVI range @ 5km [-]

0.03

NDVI range @ 10km [-]

0.03

NDVI range @ 20km [-]

0.04


Variance slope @ 1 km

8.2242716866e-06

Variance slope @ 2 km

9.9132923219e-06

Variance slope @ 5 km

8.16898927086e-06

Variance slope @ 10 km

6.0136086618e-06

Variance slope @ 20 km

5.0660800384e-06


NDVI (min. NDVI composite)I


Roman et al. (2009) index


St

3.96302652229

Rcv

-0.145862970033

Rse

0.0

Rst

0.272502987456

Rsv

-0.338631247331


NDVI range @ 1km [-]

0.01

NDVI range @ 2km [-]

0.02

NDVI range @ 5km [-]

0.02

NDVI range @ 10km [-]

0.02

NDVI range @ 20km [-]

0.04


NDVI slope @ 1 km

6.37250460333e-06

NDVI slope @ 2 km

8.18574989755e-06

NDVI slope @ 5 km

7.73890536765e-06

NDVI slope @ 10 km

6.31532534286e-06

NDVI slope @ 20 km

6.78550042587e-06


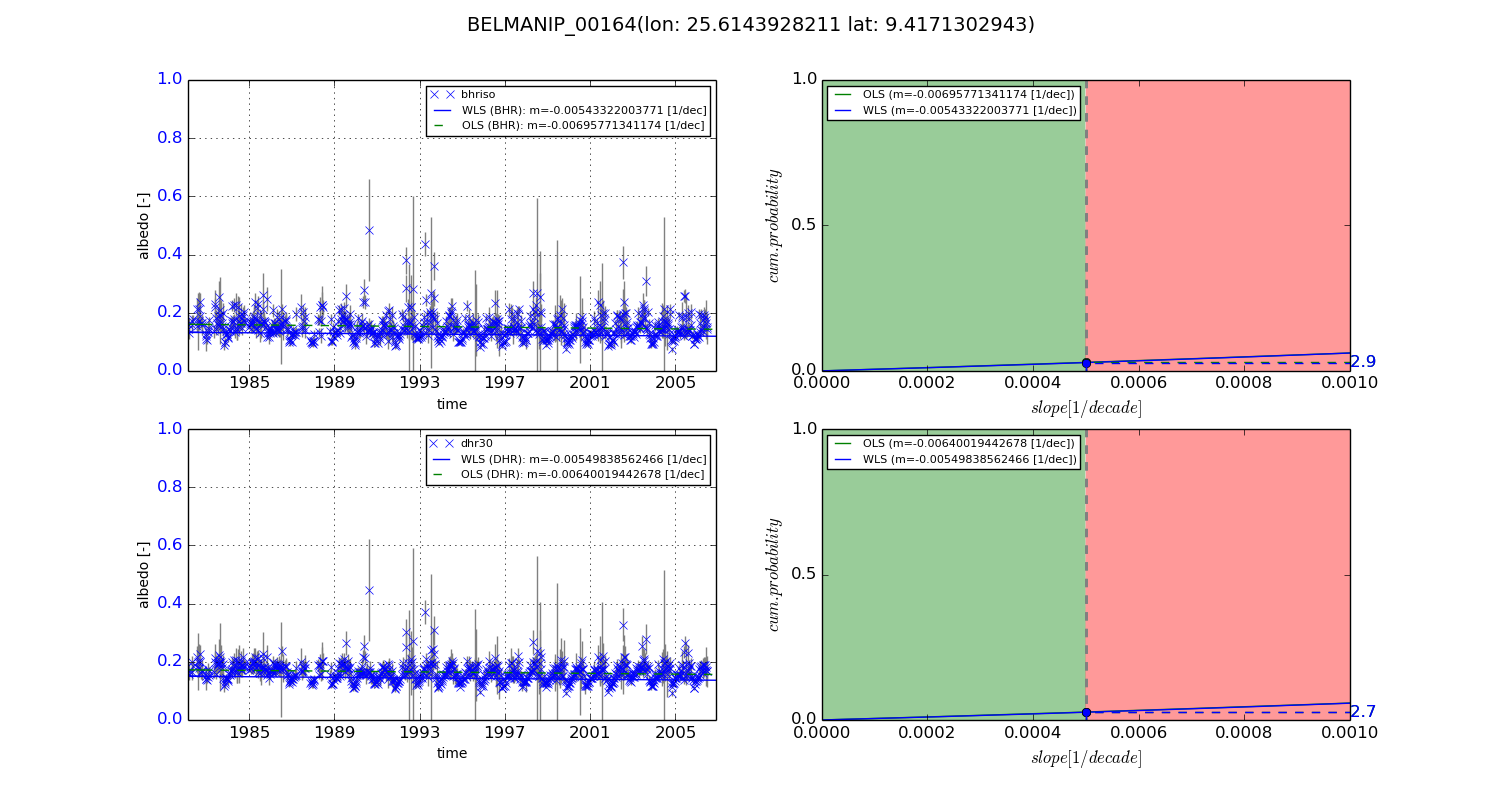
Temporal stability analysis

+000 deg (BHR)


BHR statistics

Temporal stability [1/decade]:


abs

rel


Weighted least square:

-0.00543322003771


Ordinary least square:

-0.00695771341174


Probabilities that GCOS criteria is met:

Weighted least square:

2.9 %

Ordinary least square:

2.9 %


DHR statistics

Temporal stability [1/decade]:


abs

rel


Weighted least square:

-0.00549838562466


Ordinary least square:

-0.00640019442678


Probabilities that GCOS criteria is met:

Weighted least square:

2.7 %

Ordinary least square:

2.7 %


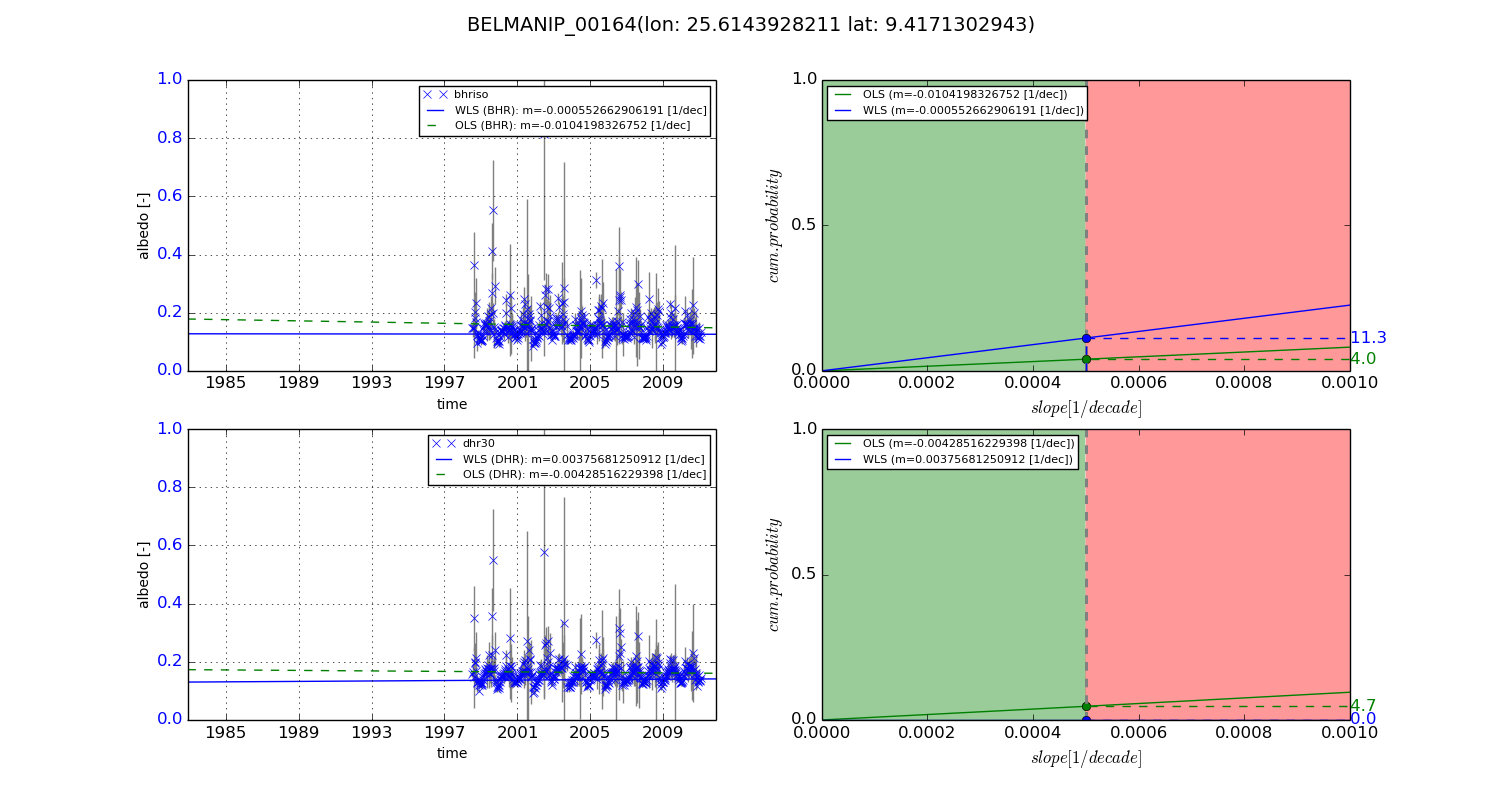
+057/+063 deg (BHR)


BHR statistics

Temporal stability [1/decade]:


abs

rel


Weighted least square:

-0.000552662906191


Ordinary least square:

-0.0104198326752


Probabilities that GCOS criteria is met:

Weighted least square:

11.3 %

Ordinary least square:

4.0 %


DHR statistics

Temporal stability [1/decade]:


abs

rel


Weighted least square:

0.00375681250912


Ordinary least square:

-0.00428516229398


Probabilities that GCOS criteria is met:

Weighted least square:

0.0 %

Ordinary least square:

4.7 %


Temporal anomaly analyis

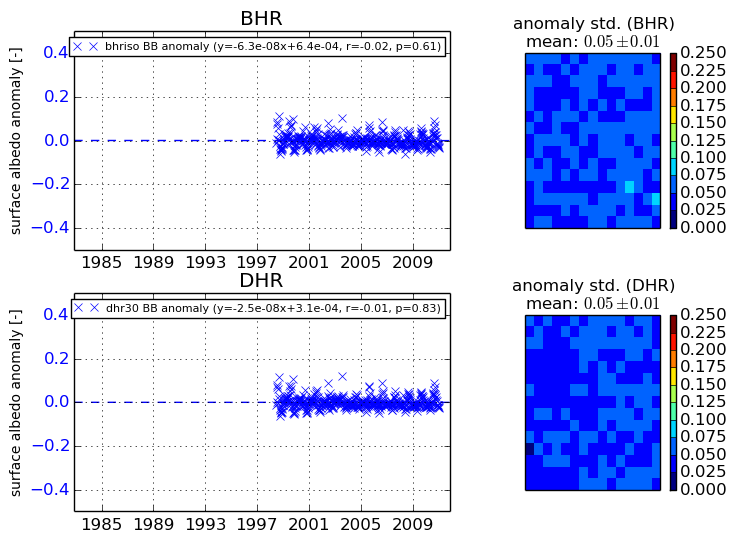
The variance of the temporal anomalies provides an additional measure about the stability of the signal AFTER removal of the mean seasonal cylce.
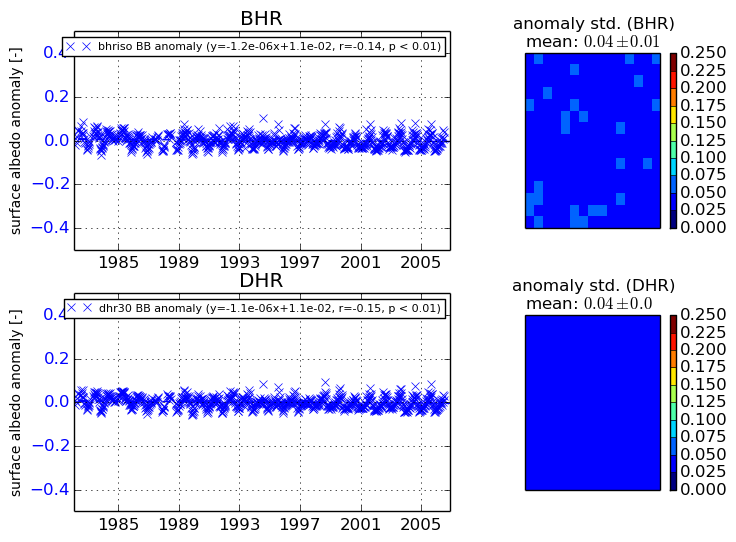
+000 deg


+057/+063 deg