BELMANIP_00168


Location

lon / lat [deg]: 47.2297 / 7.3047

Source network: BELMANIP


Geostationary surface albedo (GSA) data


“+000”


“+057/+063”


Landcover information (based on ESA CCI landcover data)


Landcover fractions @ 2km distance


Landcover fractions @ 20 km distance


Legend


Distance to open water bodies [km]:

none in region

Distance to urban areas [km]:

none in region


Radius: 1 km

Number of landcover classes:

1

Dominant landcover type:

150: Sparse vegetation (tree, shrub, herbaceous cover) (<15%)

Fraction of dominant landcover type [%]:

100.0


Radius: 2 km

Number of landcover classes:

1

Dominant landcover type:

150: Sparse vegetation (tree, shrub, herbaceous cover) (<15%)

Fraction of dominant landcover type [%]:

100.0


Radius: 5 km

Number of landcover classes:

1

Dominant landcover type:

150: Sparse vegetation (tree, shrub, herbaceous cover) (<15%)

Fraction of dominant landcover type [%]:

100.0


Radius: 10 km

Number of landcover classes:

4

Dominant landcover type:

150: Sparse vegetation (tree, shrub, herbaceous cover) (<15%)

Fraction of dominant landcover type [%]:

96.0


Radius: 20 km

Number of landcover classes:

2

Dominant landcover type:

150: Sparse vegetation (tree, shrub, herbaceous cover) (<15%)

Fraction of dominant landcover type [%]:

97.0


Disturbances


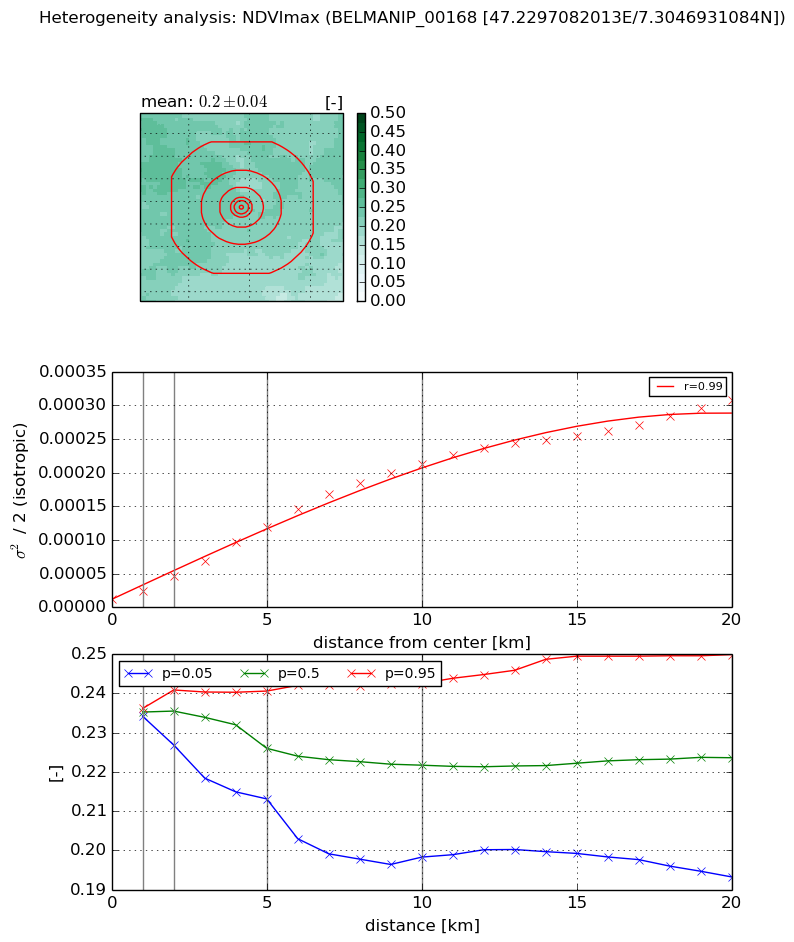
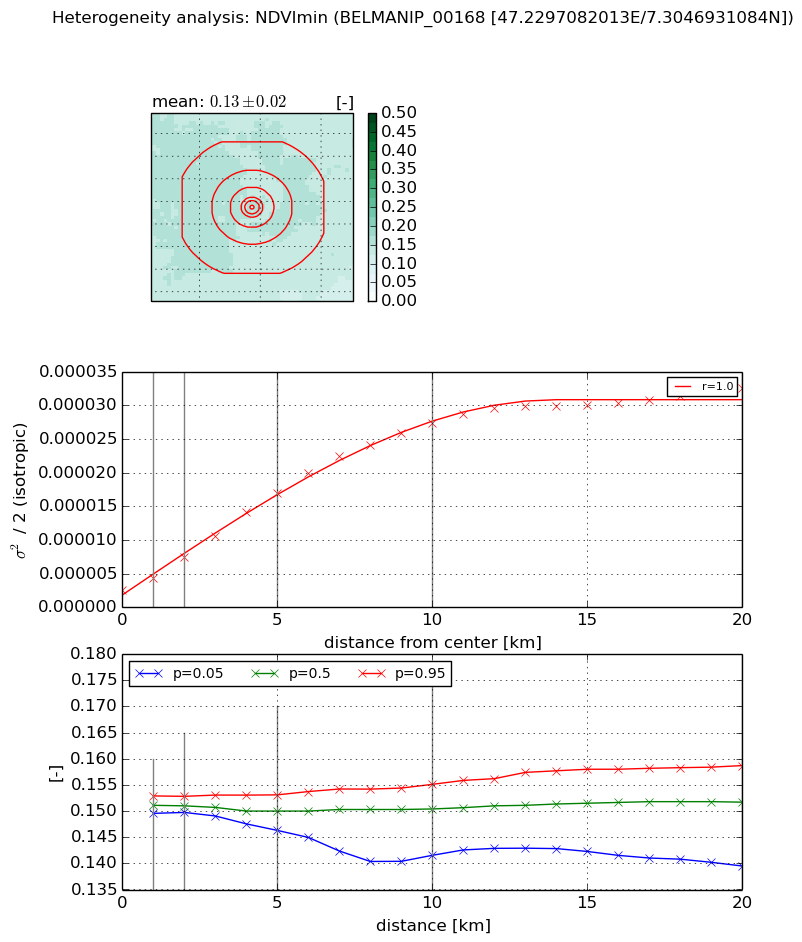
Heterogeneity analysis

The heterogeneity analysis provides information about the spatial and temporal heterogeneity of the site.

Topography


Roman et al. (2009) index


St

4.34056236027

Rcv

0.061554061684

Rse

0.0

Rst

-2.28560871812e-05

Rsv

-0.629577764733


Height range @ 1km [m]

17

Height range @ 2km [m]

30

Height range @ 5km [m]

32

Height range @ 10km [m]

-999

Height range @ 20km [m]

-999


Variance slope @ 1 km

8

Variance slope @ 2 km

12

Variance slope @ 5 km

22

Variance slope @ 10 km

-999

Variance slope @ 20 km

-999


NDVI (max. NDVI composite)


Roman et al. (2009) index


St

2.86178630269

Rcv

0.51932432451

Rse

0.0

Rst

-0.0835939740285

Rsv

0.445378004081


NDVI range @ 1km [-]

0.0

NDVI range @ 2km [-]

0.01

NDVI range @ 5km [-]

0.03

NDVI range @ 10km [-]

0.04

NDVI range @ 20km [-]

0.06


Variance slope @ 1 km

1.16388469523e-05

Variance slope @ 2 km

1.66621806631e-05

Variance slope @ 5 km

2.21947808948e-05

Variance slope @ 10 km

2.15725967484e-05

Variance slope @ 20 km

1.45007359728e-05


NDVI (min. NDVI composite)I


Roman et al. (2009) index


St

1.17123692478

Rcv

0.7389566888

Rse

0.0

Rst

-0.714842631115

Rsv

1.10759533605


NDVI range @ 1km [-]

0.0

NDVI range @ 2km [-]

0.0

NDVI range @ 5km [-]

0.01

NDVI range @ 10km [-]

0.01

NDVI range @ 20km [-]

0.02


NDVI slope @ 1 km

1.78396477753e-06

NDVI slope @ 2 km

2.47578622927e-06

NDVI slope @ 5 km

3.00033541302e-06

NDVI slope @ 10 km

2.64048165232e-06

NDVI slope @ 20 km

1.45534806502e-06


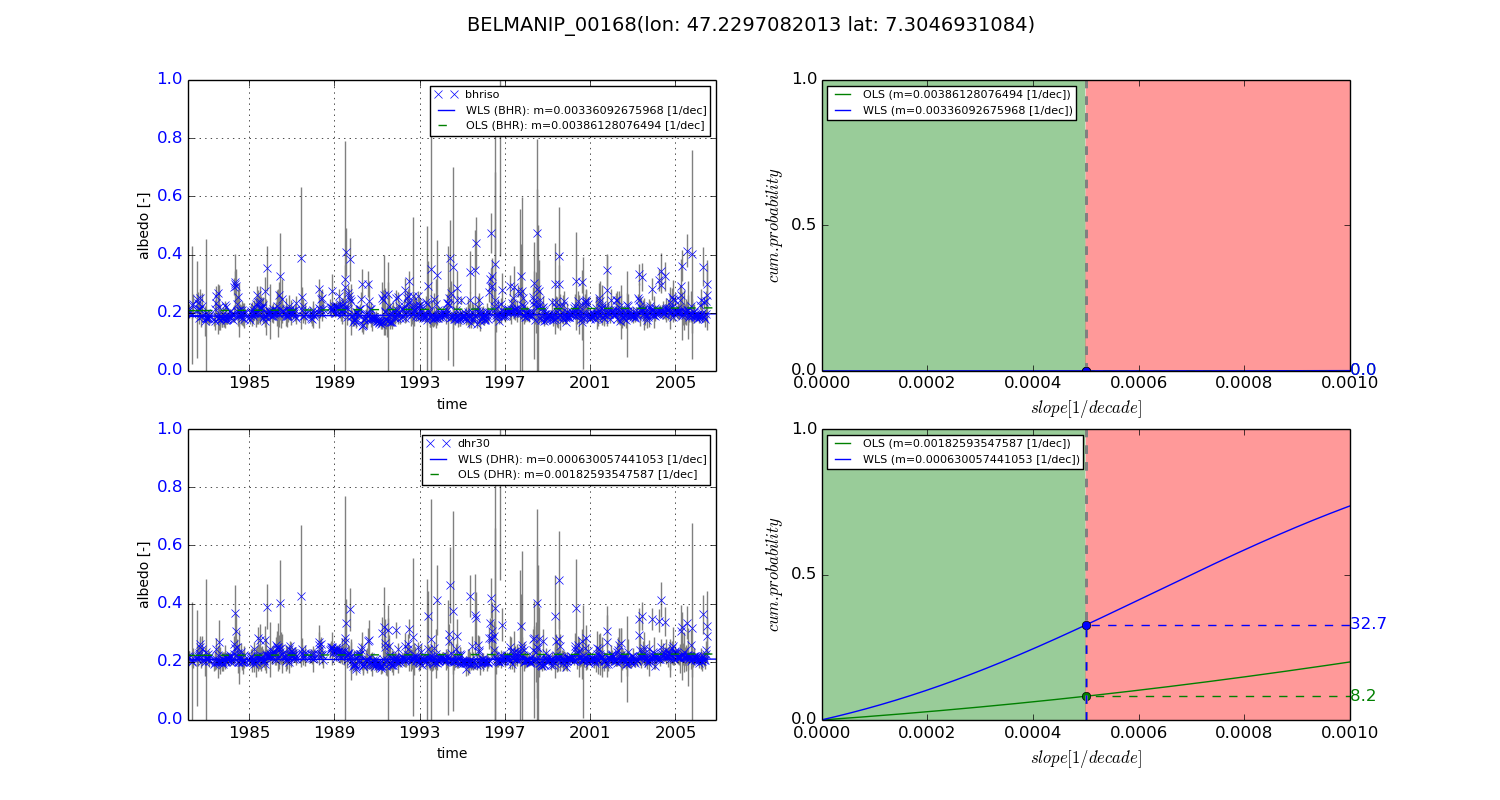
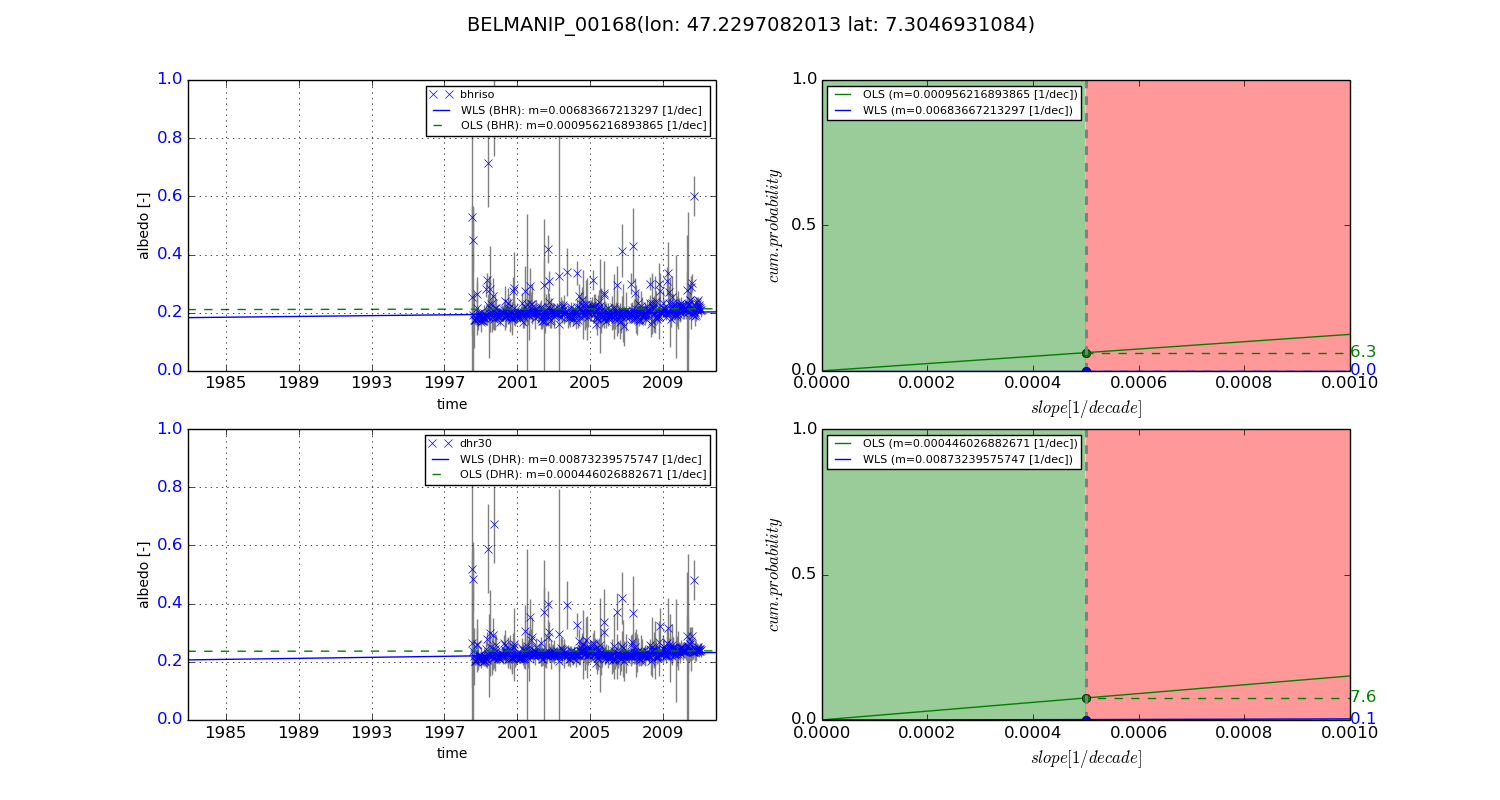
Temporal stability analysis

+000 deg (BHR)


BHR statistics

Temporal stability [1/decade]:


abs

rel


Weighted least square:

0.00336092675968


Ordinary least square:

0.00386128076494


Probabilities that GCOS criteria is met:

Weighted least square:

0.0 %

Ordinary least square:

0.0 %


DHR statistics

Temporal stability [1/decade]:


abs

rel


Weighted least square:

0.000630057441053


Ordinary least square:

0.00182593547587


Probabilities that GCOS criteria is met:

Weighted least square:

32.7 %

Ordinary least square:

8.2 %


+057/+063 deg (BHR)


BHR statistics

Temporal stability [1/decade]:


abs

rel


Weighted least square:

0.00683667213297


Ordinary least square:

0.000956216893865


Probabilities that GCOS criteria is met:

Weighted least square:

0.0 %

Ordinary least square:

6.3 %


DHR statistics

Temporal stability [1/decade]:


abs

rel


Weighted least square:

0.00873239575747


Ordinary least square:

0.000446026882671


Probabilities that GCOS criteria is met:

Weighted least square:

0.1 %

Ordinary least square:

7.6 %


Temporal anomaly analyis

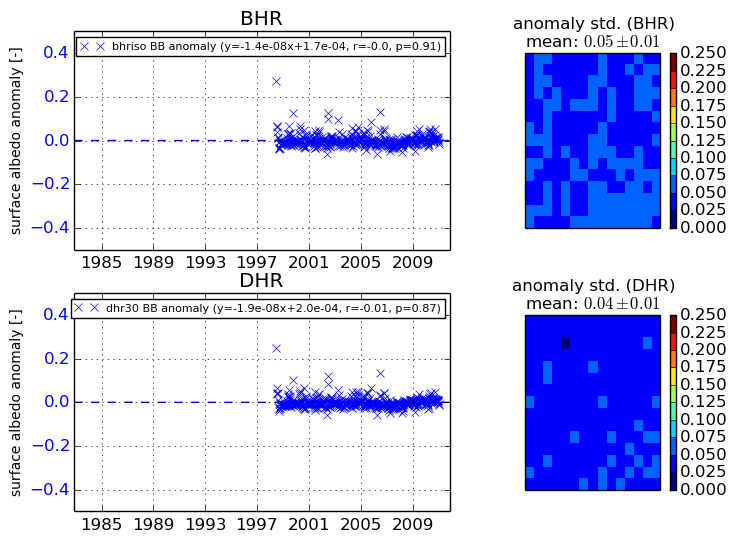
The variance of the temporal anomalies provides an additional measure about the stability of the signal AFTER removal of the mean seasonal cylce.
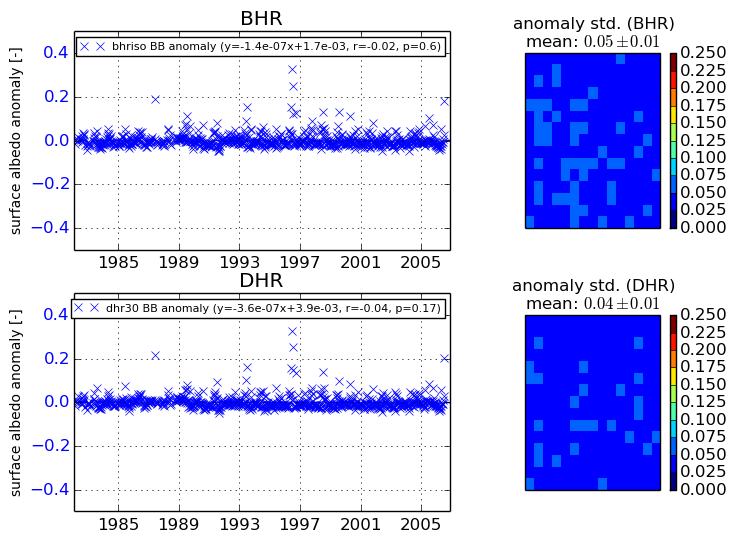
+000 deg


+057/+063 deg