BELMANIP_00169


Location

lon / lat [deg]: 36.9866 / 3.2978

Source network: BELMANIP


Geostationary surface albedo (GSA) data


“+000”


“+057/+063”


Landcover information (based on ESA CCI landcover data)


Landcover fractions @ 2km distance


Landcover fractions @ 20 km distance


Legend


Distance to open water bodies [km]:

49.49

Distance to urban areas [km]:

none in region


Radius: 1 km

Number of landcover classes:

3

Dominant landcover type:

200: bare areas

Fraction of dominant landcover type [%]:

75.0


Radius: 2 km

Number of landcover classes:

3

Dominant landcover type:

200: bare areas

Fraction of dominant landcover type [%]:

68.0


Radius: 5 km

Number of landcover classes:

3

Dominant landcover type:

200: bare areas

Fraction of dominant landcover type [%]:

82.0


Radius: 10 km

Number of landcover classes:

3

Dominant landcover type:

200: bare areas

Fraction of dominant landcover type [%]:

75.0


Radius: 20 km

Number of landcover classes:

3

Dominant landcover type:

200: bare areas

Fraction of dominant landcover type [%]:

71.0


Disturbances


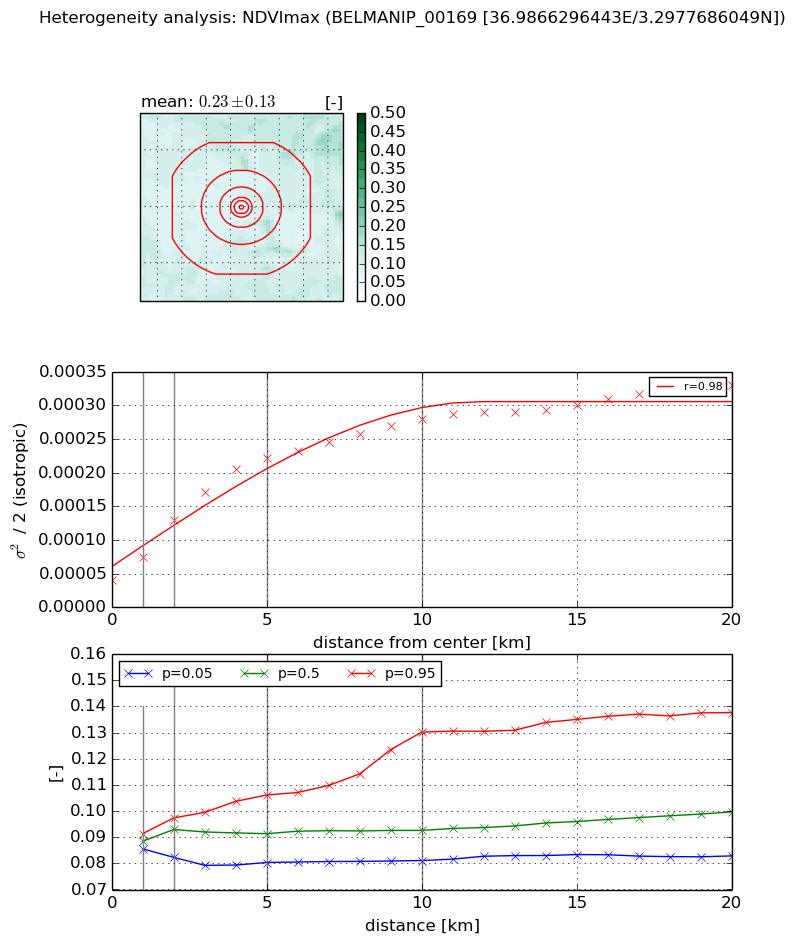
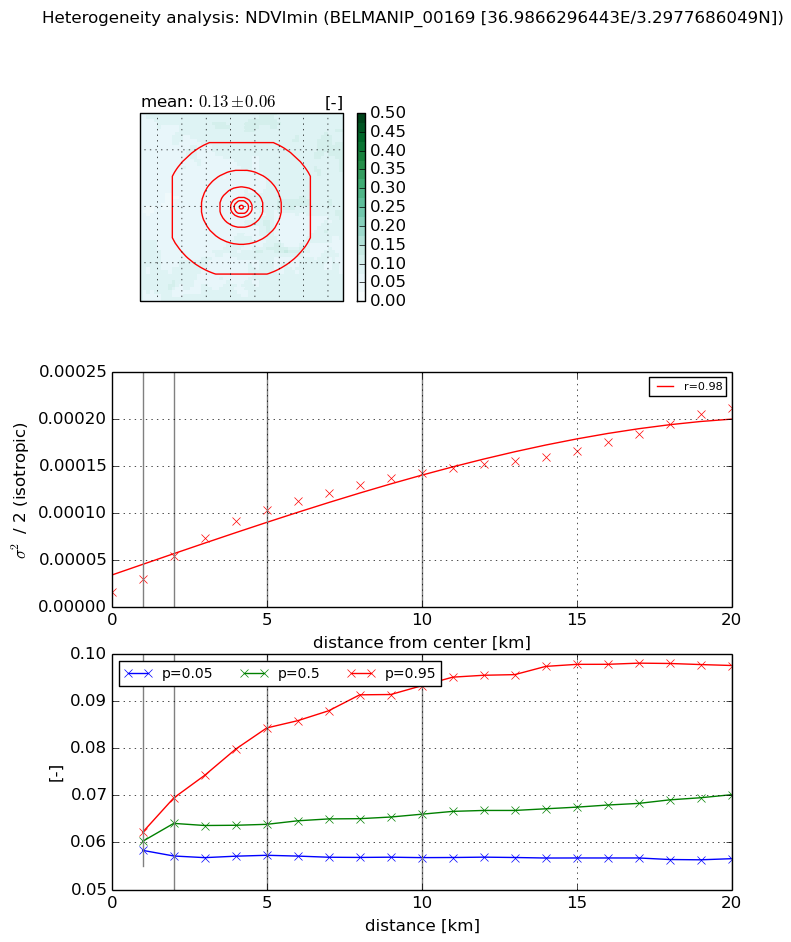
Heterogeneity analysis

The heterogeneity analysis provides information about the spatial and temporal heterogeneity of the site.

Topography


Roman et al. (2009) index


St

1.94189296118

Rcv

0.544916791793

Rse

0.0

Rst

-6.62168146254e-05

Rsv

-0.999901318167


Height range @ 1km [m]

9

Height range @ 2km [m]

14

Height range @ 5km [m]

31

Height range @ 10km [m]

-999

Height range @ 20km [m]

-999


Variance slope @ 1 km

5

Variance slope @ 2 km

8

Variance slope @ 5 km

18

Variance slope @ 10 km

-999

Variance slope @ 20 km

-999


NDVI (max. NDVI composite)


Roman et al. (2009) index


St

1.97950589273

Rcv

0.243272280263

Rse

0.0

Rst

-0.272257503042

Rsv

-0.99999993096


NDVI range @ 1km [-]

0.01

NDVI range @ 2km [-]

0.02

NDVI range @ 5km [-]

0.03

NDVI range @ 10km [-]

0.05

NDVI range @ 20km [-]

0.05


Variance slope @ 1 km

3.44005602818e-05

Variance slope @ 2 km

4.49540812063e-05

Variance slope @ 5 km

3.83237202122e-05

Variance slope @ 10 km

2.30185546611e-05

Variance slope @ 20 km

1.1994184601e-05


NDVI (min. NDVI composite)I


Roman et al. (2009) index


St

nan

Rcv

nan

Rse

nan

Rst

nan

Rsv

nan


NDVI range @ 1km [-]

0.0

NDVI range @ 2km [-]

0.01

NDVI range @ 5km [-]

0.03

NDVI range @ 10km [-]

0.04

NDVI range @ 20km [-]

0.04


NDVI slope @ 1 km

1.41252872054e-05

NDVI slope @ 2 km

1.88772124133e-05

NDVI slope @ 5 km

1.82553085138e-05

NDVI slope @ 10 km

1.27569205238e-05

NDVI slope @ 20 km

8.55049543773e-06


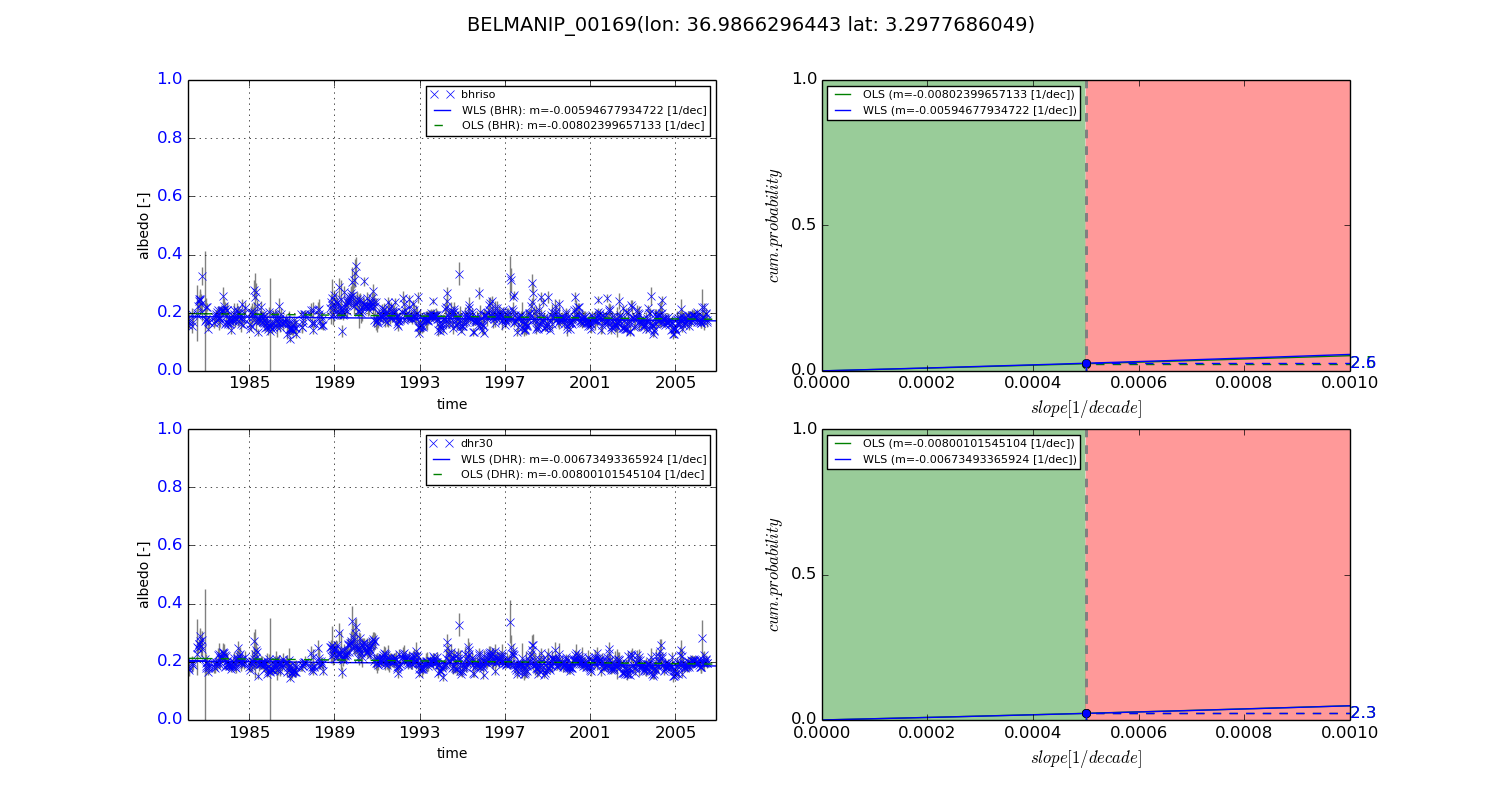
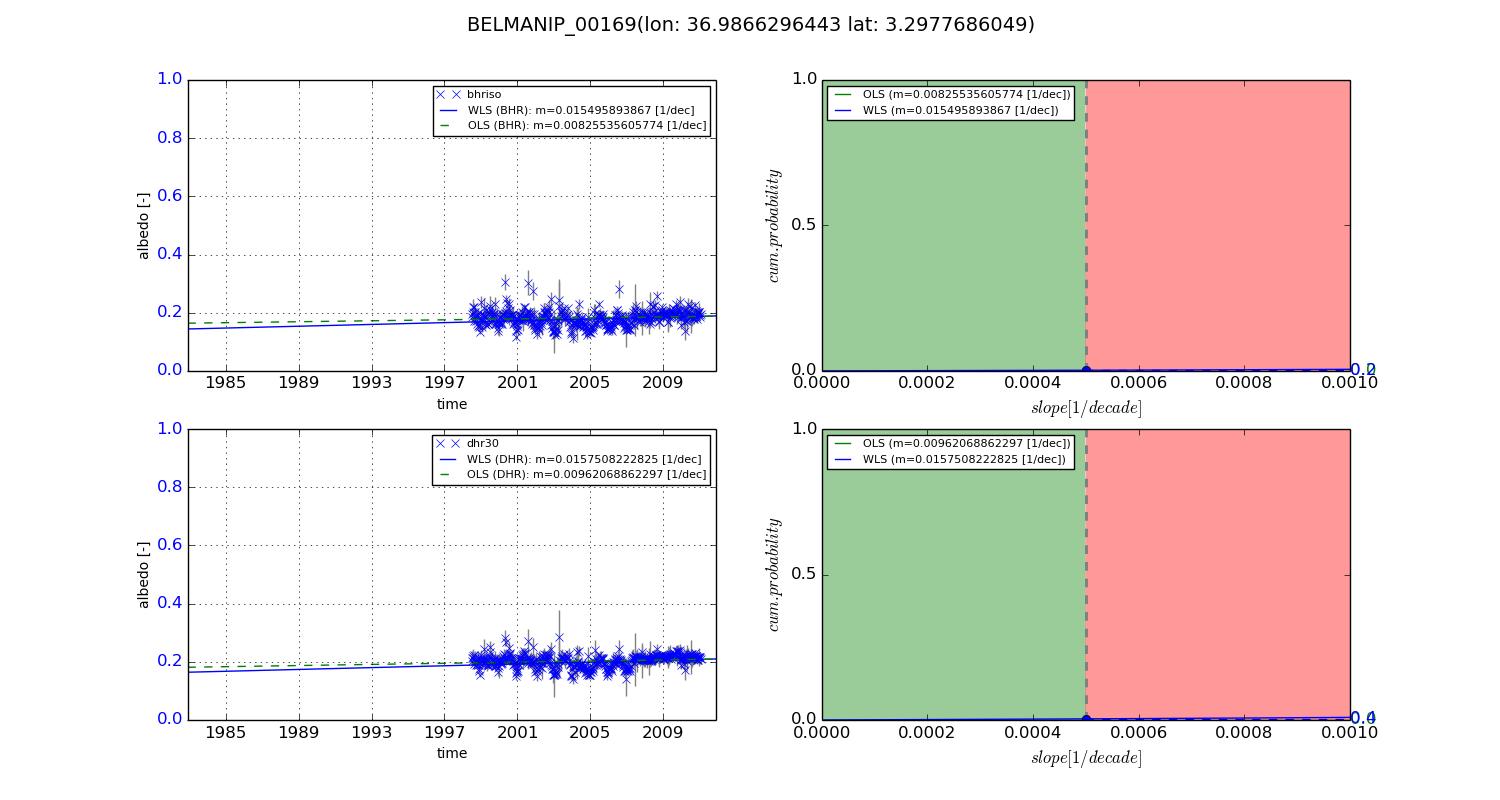
Temporal stability analysis

+000 deg (BHR)


BHR statistics

Temporal stability [1/decade]:


abs

rel


Weighted least square:

-0.00594677934722


Ordinary least square:

-0.00802399657133


Probabilities that GCOS criteria is met:

Weighted least square:

2.6 %

Ordinary least square:

2.5 %


DHR statistics

Temporal stability [1/decade]:


abs

rel


Weighted least square:

-0.00673493365924


Ordinary least square:

-0.00800101545104


Probabilities that GCOS criteria is met:

Weighted least square:

2.3 %

Ordinary least square:

2.3 %


+057/+063 deg (BHR)


BHR statistics

Temporal stability [1/decade]:


abs

rel


Weighted least square:

0.015495893867


Ordinary least square:

0.00825535605774


Probabilities that GCOS criteria is met:

Weighted least square:

0.2 %

Ordinary least square:

0.0 %


DHR statistics

Temporal stability [1/decade]:


abs

rel


Weighted least square:

0.0157508222825


Ordinary least square:

0.00962068862297


Probabilities that GCOS criteria is met:

Weighted least square:

0.4 %

Ordinary least square:

0.0 %


Temporal anomaly analyis

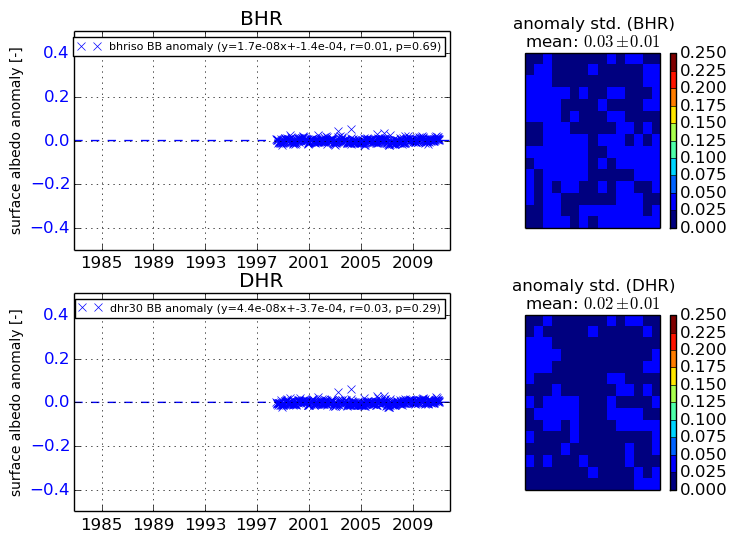
The variance of the temporal anomalies provides an additional measure about the stability of the signal AFTER removal of the mean seasonal cylce.
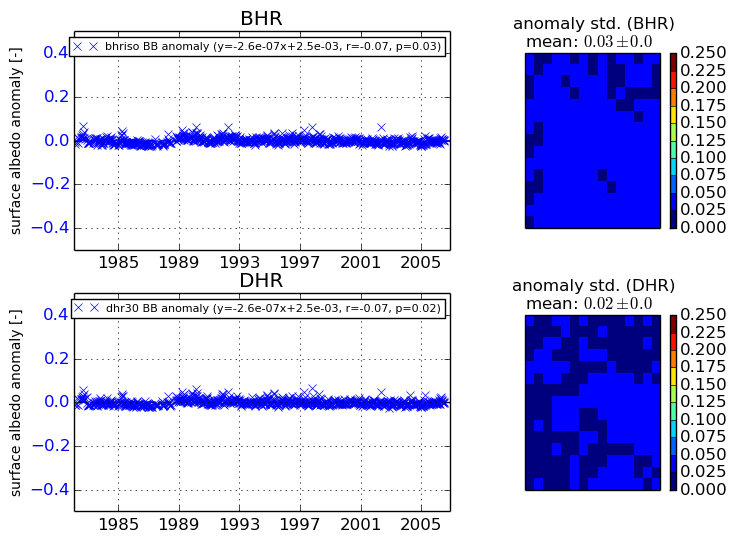
+000 deg


+057/+063 deg