BELMANIP_00182


Location

lon / lat [deg]: 49.8913 / 10.9506

Source network: BELMANIP


Geostationary surface albedo (GSA) data


“+000”


“+057/+063”


Landcover information (based on ESA CCI landcover data)


Landcover fractions @ 2km distance


Landcover fractions @ 20 km distance


Legend


Distance to open water bodies [km]:

62.76

Distance to urban areas [km]:

none in region


Radius: 1 km

Number of landcover classes:

2

Dominant landcover type:

120: Shrubland

Fraction of dominant landcover type [%]:

94.0


Radius: 2 km

Number of landcover classes:

2

Dominant landcover type:

120: Shrubland

Fraction of dominant landcover type [%]:

99.0


Radius: 5 km

Number of landcover classes:

1

Dominant landcover type:

120: Shrubland

Fraction of dominant landcover type [%]:

100.0


Radius: 10 km

Number of landcover classes:

1

Dominant landcover type:

120: Shrubland

Fraction of dominant landcover type [%]:

99.0


Radius: 20 km

Number of landcover classes:

2

Dominant landcover type:

120: Shrubland

Fraction of dominant landcover type [%]:

96.0


Disturbances


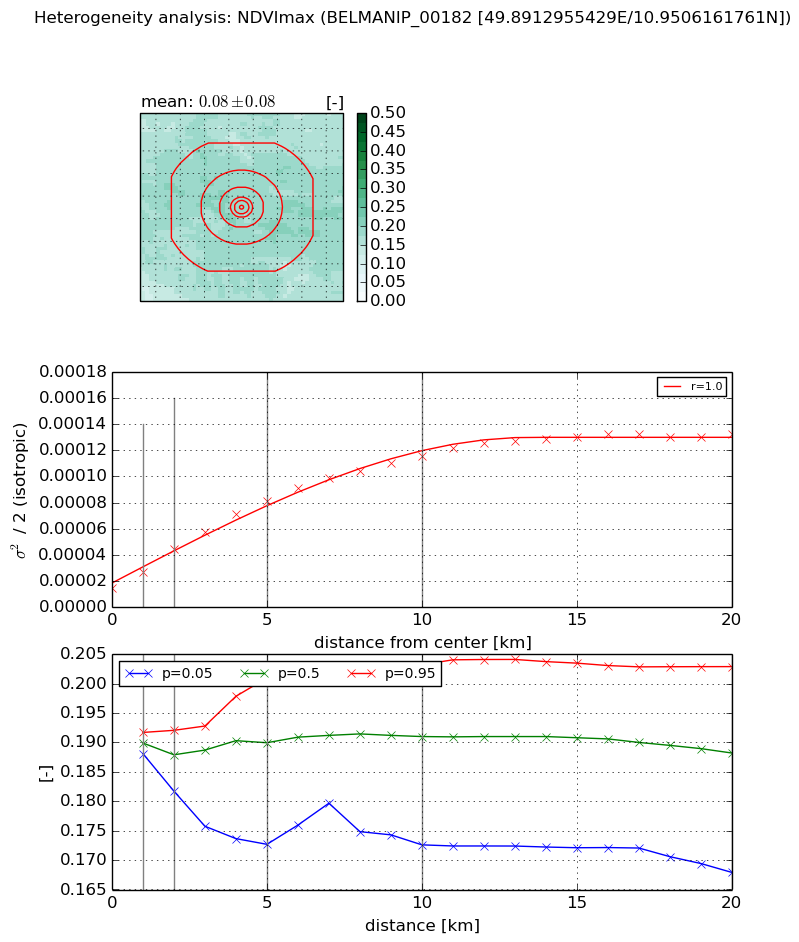
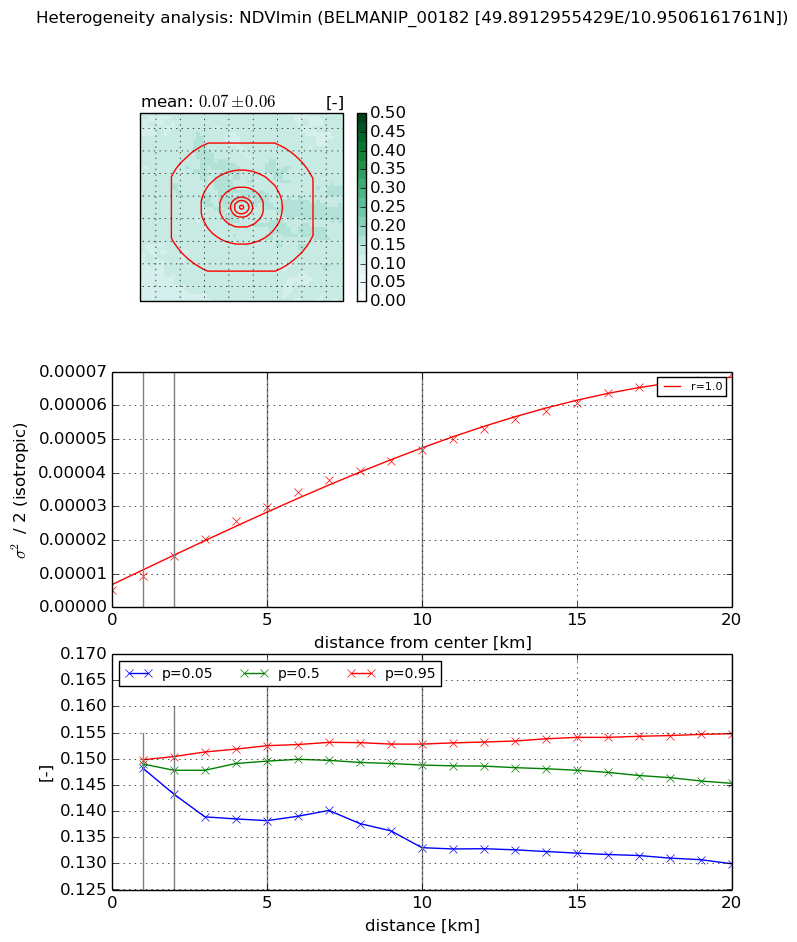
Heterogeneity analysis

The heterogeneity analysis provides information about the spatial and temporal heterogeneity of the site.

Topography


Roman et al. (2009) index


St

0.836669030425

Rcv

0.154921984209

Rse

0.0

Rst

-1.26139179413e-05

Rsv

3.43071264219


Height range @ 1km [m]

217

Height range @ 2km [m]

218

Height range @ 5km [m]

313

Height range @ 10km [m]

-999

Height range @ 20km [m]

-999


Variance slope @ 1 km

3499

Variance slope @ 2 km

2444

Variance slope @ 5 km

1437

Variance slope @ 10 km

-999

Variance slope @ 20 km

-999


NDVI (max. NDVI composite)


Roman et al. (2009) index


St

5.09567262161

Rcv

0.366970760559

Rse

0.0

Rst

0.149523129404

Rsv

-0.0722409489434


NDVI range @ 1km [-]

0.0

NDVI range @ 2km [-]

0.01

NDVI range @ 5km [-]

0.03

NDVI range @ 10km [-]

0.03

NDVI range @ 20km [-]

0.03


Variance slope @ 1 km

1.17227112926e-05

Variance slope @ 2 km

1.46698761936e-05

Variance slope @ 5 km

1.36410432011e-05

Variance slope @ 10 km

1.01983549331e-05

Variance slope @ 20 km

5.48634727536e-06


NDVI (min. NDVI composite)I


Roman et al. (2009) index


St

8.57121020364

Rcv

0.102404015962

Rse

0.0

Rst

0.00904083712014

Rsv

0.23856406383


NDVI range @ 1km [-]

0.0

NDVI range @ 2km [-]

0.01

NDVI range @ 5km [-]

0.01

NDVI range @ 10km [-]

0.02

NDVI range @ 20km [-]

0.02


NDVI slope @ 1 km

4.0233033624e-06

NDVI slope @ 2 km

5.07049812672e-06

NDVI slope @ 5 km

5.074557997e-06

NDVI slope @ 10 km

4.23003051895e-06

NDVI slope @ 20 km

3.19685468039e-06


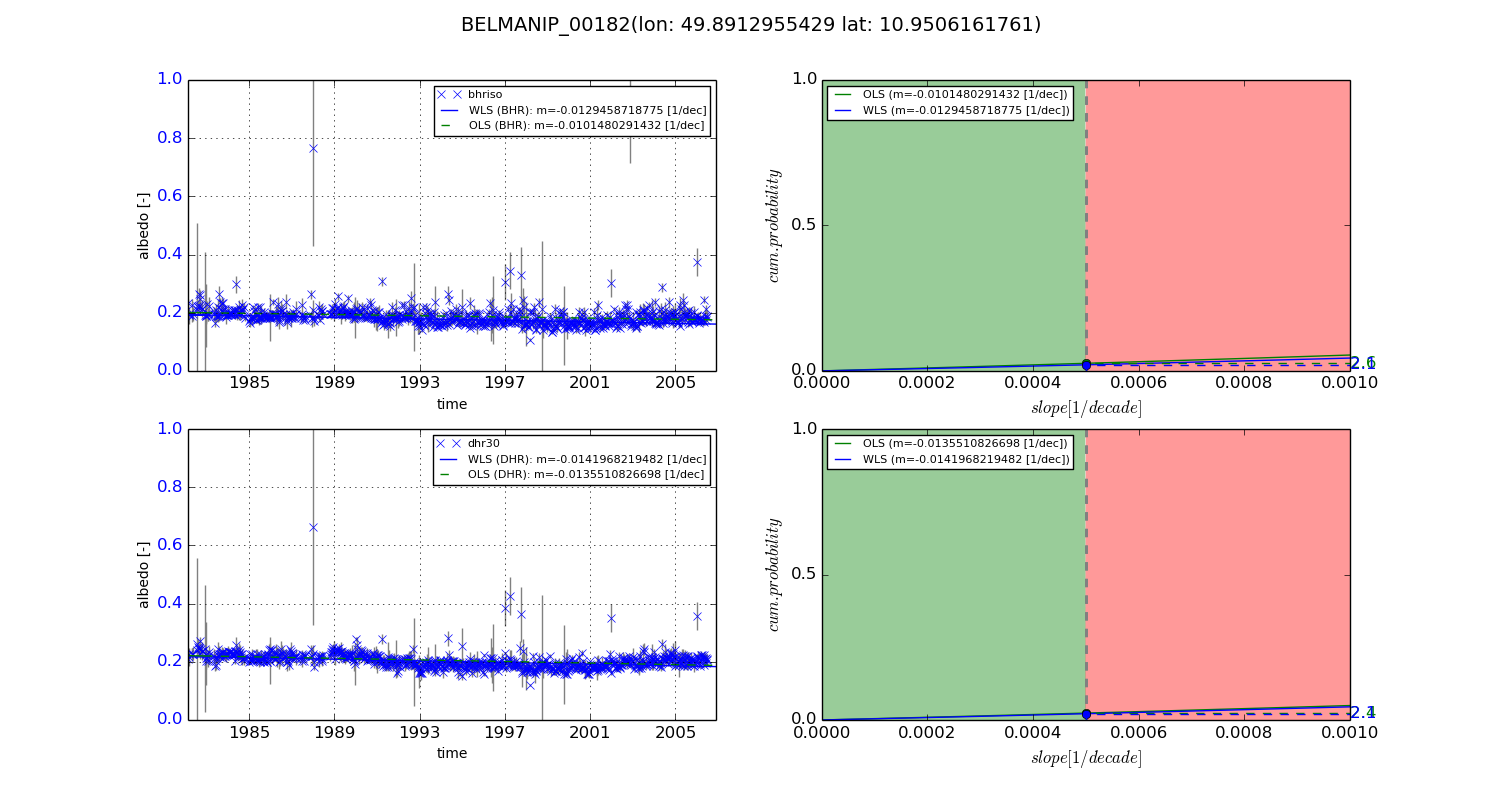
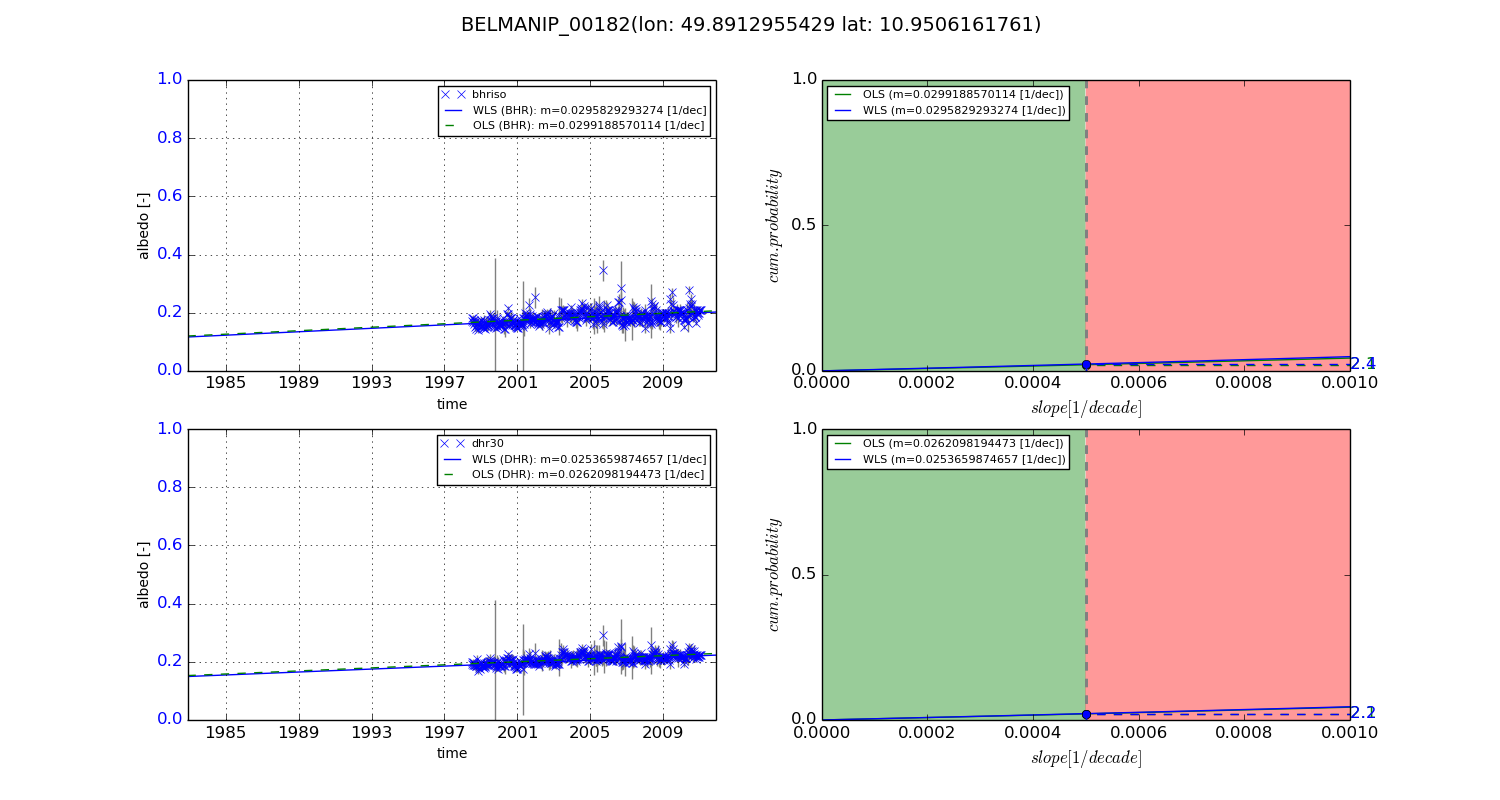
Temporal stability analysis

+000 deg (BHR)


BHR statistics

Temporal stability [1/decade]:


abs

rel


Weighted least square:

-0.0129458718775


Ordinary least square:

-0.0101480291432


Probabilities that GCOS criteria is met:

Weighted least square:

2.1 %

Ordinary least square:

2.6 %


DHR statistics

Temporal stability [1/decade]:


abs

rel


Weighted least square:

-0.0141968219482


Ordinary least square:

-0.0135510826698


Probabilities that GCOS criteria is met:

Weighted least square:

2.1 %

Ordinary least square:

2.4 %


+057/+063 deg (BHR)


BHR statistics

Temporal stability [1/decade]:


abs

rel


Weighted least square:

0.0295829293274


Ordinary least square:

0.0299188570114


Probabilities that GCOS criteria is met:

Weighted least square:

2.4 %

Ordinary least square:

2.1 %


DHR statistics

Temporal stability [1/decade]:


abs

rel


Weighted least square:

0.0253659874657


Ordinary least square:

0.0262098194473


Probabilities that GCOS criteria is met:

Weighted least square:

2.2 %

Ordinary least square:

2.1 %


Temporal anomaly analyis

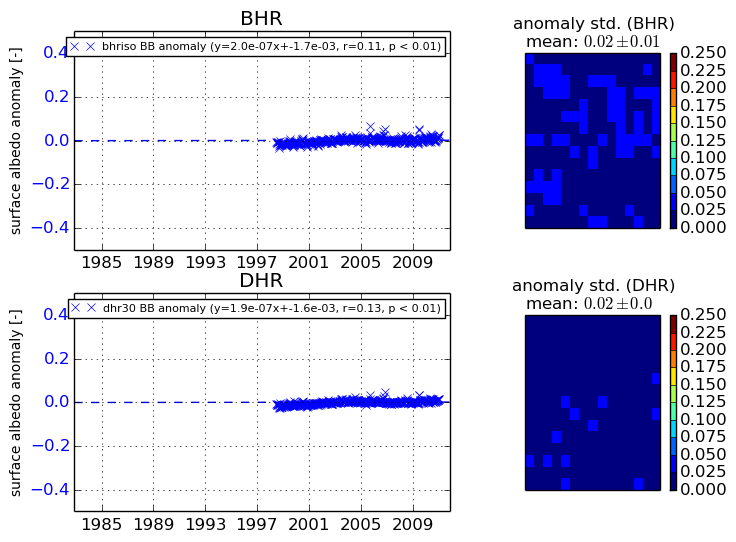
The variance of the temporal anomalies provides an additional measure about the stability of the signal AFTER removal of the mean seasonal cylce.
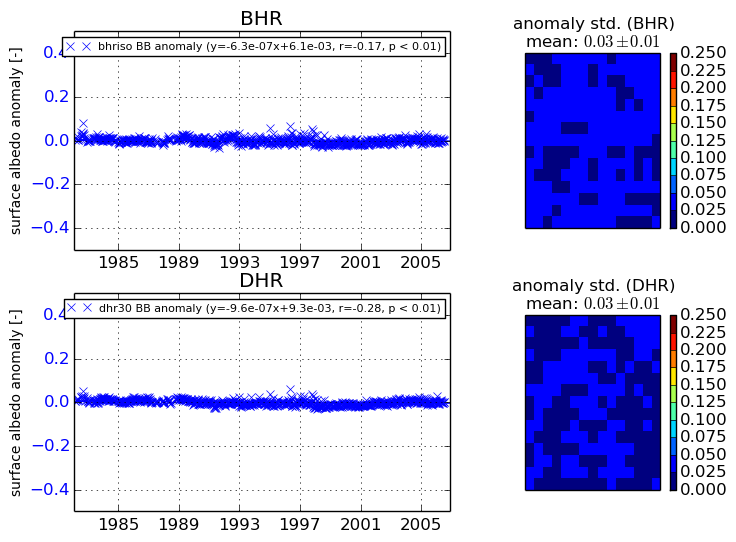
+000 deg


+057/+063 deg