BELMANIP_00187


Location

lon / lat [deg]: -8.8249 / 14.0354

Source network: BELMANIP


Geostationary surface albedo (GSA) data


“+000”


“+057/+063”


Landcover information (based on ESA CCI landcover data)


Landcover fractions @ 2km distance


Landcover fractions @ 20 km distance


Legend


Distance to open water bodies [km]:

none in region

Distance to urban areas [km]:

none in region


Radius: 1 km

Number of landcover classes:

5

Dominant landcover type:

120: Shrubland

Fraction of dominant landcover type [%]:

53.0


Radius: 2 km

Number of landcover classes:

5

Dominant landcover type:

120: Shrubland

Fraction of dominant landcover type [%]:

50.0


Radius: 5 km

Number of landcover classes:

5

Dominant landcover type:

120: Shrubland

Fraction of dominant landcover type [%]:

52.0


Radius: 10 km

Number of landcover classes:

5

Dominant landcover type:

120: Shrubland

Fraction of dominant landcover type [%]:

53.0


Radius: 20 km

Number of landcover classes:

5

Dominant landcover type:

120: Shrubland

Fraction of dominant landcover type [%]:

50.0


Disturbances


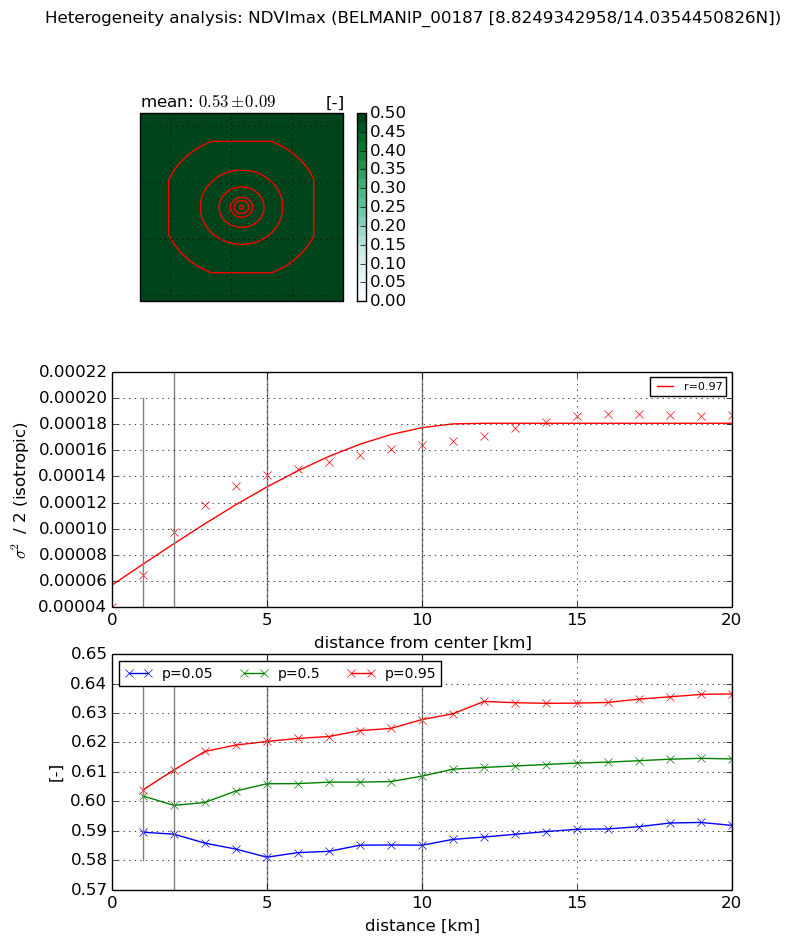
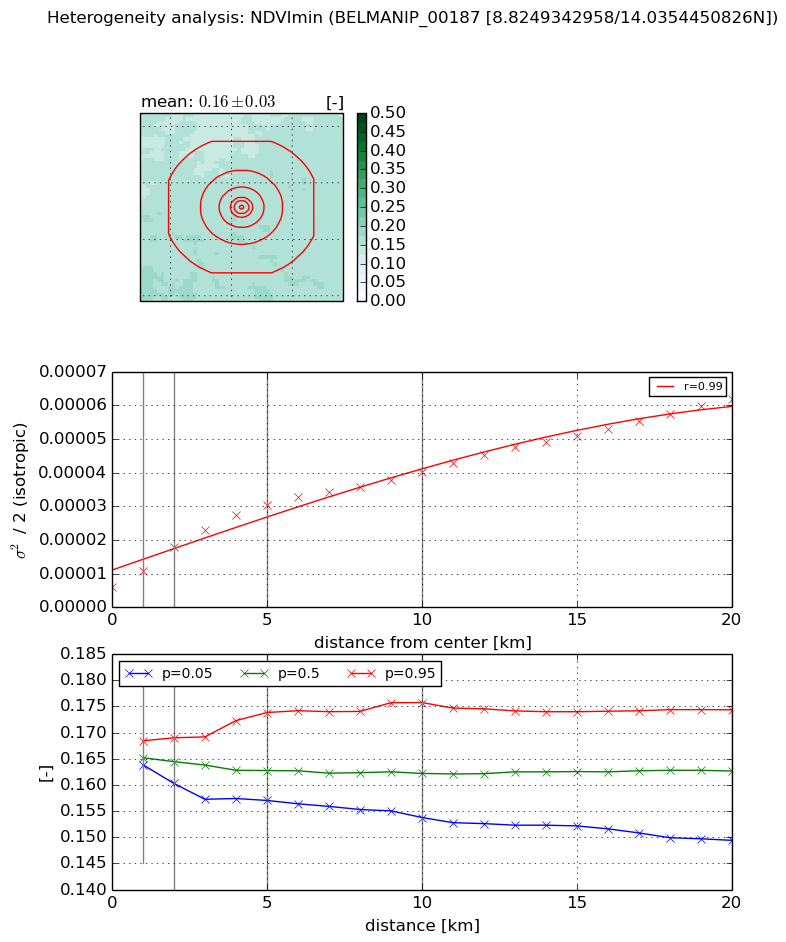
Heterogeneity analysis

The heterogeneity analysis provides information about the spatial and temporal heterogeneity of the site.

Topography


Roman et al. (2009) index


St

1.74080583597e-05

Rcv

1.19648292345

Rse

0.0

Rst

-0.142371234328

Rsv

172332.642226


Height range @ 1km [m]

14

Height range @ 2km [m]

21

Height range @ 5km [m]

60

Height range @ 10km [m]

-999

Height range @ 20km [m]

-999


Variance slope @ 1 km

163

Variance slope @ 2 km

123

Variance slope @ 5 km

63

Variance slope @ 10 km

-999

Variance slope @ 20 km

-999


NDVI (max. NDVI composite)


Roman et al. (2009) index


St

0.931905168712

Rcv

0.255782798885

Rse

0.0

Rst

-0.545506587094

Rsv

2.41792228997


NDVI range @ 1km [-]

0.01

NDVI range @ 2km [-]

0.02

NDVI range @ 5km [-]

0.04

NDVI range @ 10km [-]

0.04

NDVI range @ 20km [-]

0.04


Variance slope @ 1 km

2.40129284526e-05

Variance slope @ 2 km

2.85205246593e-05

Variance slope @ 5 km

2.07747823752e-05

Variance slope @ 10 km

1.14344347399e-05

Variance slope @ 20 km

5.95340369788e-06


NDVI (min. NDVI composite)I


Roman et al. (2009) index


St

3.29466306017

Rcv

0.287231139652

Rse

0.0

Rst

-0.221254167414

Rsv

0.402078214973


NDVI range @ 1km [-]

0.0

NDVI range @ 2km [-]

0.01

NDVI range @ 5km [-]

0.02

NDVI range @ 10km [-]

0.02

NDVI range @ 20km [-]

0.02


NDVI slope @ 1 km

4.74680256714e-06

NDVI slope @ 2 km

5.89591358143e-06

NDVI slope @ 5 km

5.0667728791e-06

NDVI slope @ 10 km

3.28565306462e-06

NDVI slope @ 20 km

2.50097709546e-06


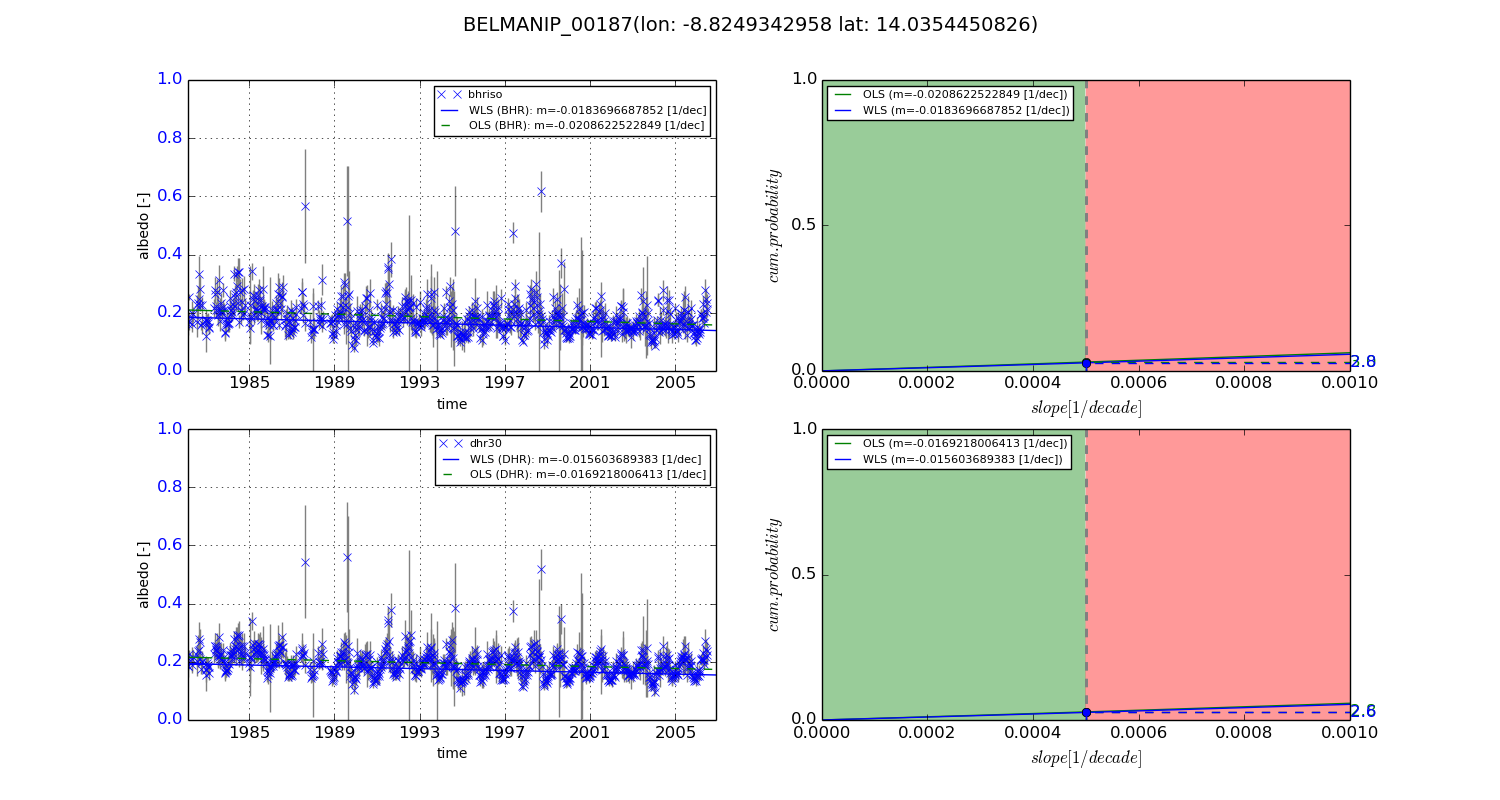
Temporal stability analysis

+000 deg (BHR)


BHR statistics

Temporal stability [1/decade]:


abs

rel


Weighted least square:

-0.0183696687852


Ordinary least square:

-0.0208622522849


Probabilities that GCOS criteria is met:

Weighted least square:

2.8 %

Ordinary least square:

3.0 %


DHR statistics

Temporal stability [1/decade]:


abs

rel


Weighted least square:

-0.015603689383


Ordinary least square:

-0.0169218006413


Probabilities that GCOS criteria is met:

Weighted least square:

2.6 %

Ordinary least square:

2.8 %


+057/+063 deg (BHR)


BHR statistics

Temporal stability [1/decade]:


abs

rel


Weighted least square:

-99999.0


Ordinary least square:

-99999.0


Probabilities that GCOS criteria is met:

Weighted least square:

-99999.0 %

Ordinary least square:

-99999.0 %


DHR statistics

Temporal stability [1/decade]:


abs

rel


Weighted least square:

-99999.0


Ordinary least square:

-99999.0


Probabilities that GCOS criteria is met:

Weighted least square:

-99999.0 %

Ordinary least square:

-99999.0 %


Temporal anomaly analyis

The variance of the temporal anomalies provides an additional measure about the stability of the signal AFTER removal of the mean seasonal cylce.
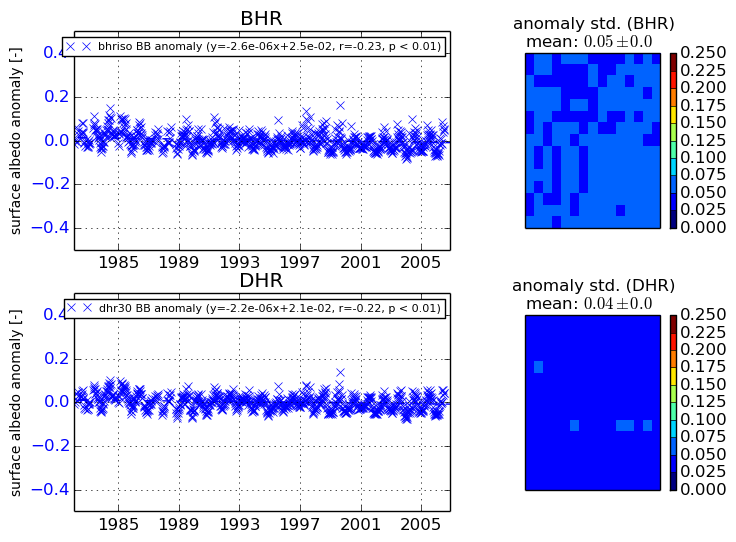
+000 deg


+057/+063 deg