BELMANIP_00188


Location

lon / lat [deg]: 16.3392 / 10.9674

Source network: BELMANIP


Geostationary surface albedo (GSA) data


“+000”


“+057/+063”


Landcover information (based on ESA CCI landcover data)


Landcover fractions @ 2km distance


Landcover fractions @ 20 km distance


Legend


Distance to open water bodies [km]:

29.56

Distance to urban areas [km]:

51.08


Radius: 1 km

Number of landcover classes:

3

Dominant landcover type:

40: mosaic natural vegetation (tree, shrub, herbaceous cover) (>50%) / cropland (<50%)

Fraction of dominant landcover type [%]:

47.0


Radius: 2 km

Number of landcover classes:

4

Dominant landcover type:

30: mosaic cropland (>50%), natural veg. (< 50%)

Fraction of dominant landcover type [%]:

45.0


Radius: 5 km

Number of landcover classes:

4

Dominant landcover type:

10: cropland, rainfed

Fraction of dominant landcover type [%]:

47.0


Radius: 10 km

Number of landcover classes:

3

Dominant landcover type:

10: cropland, rainfed

Fraction of dominant landcover type [%]:

62.0


Radius: 20 km

Number of landcover classes:

4

Dominant landcover type:

10: cropland, rainfed

Fraction of dominant landcover type [%]:

72.0


Disturbances


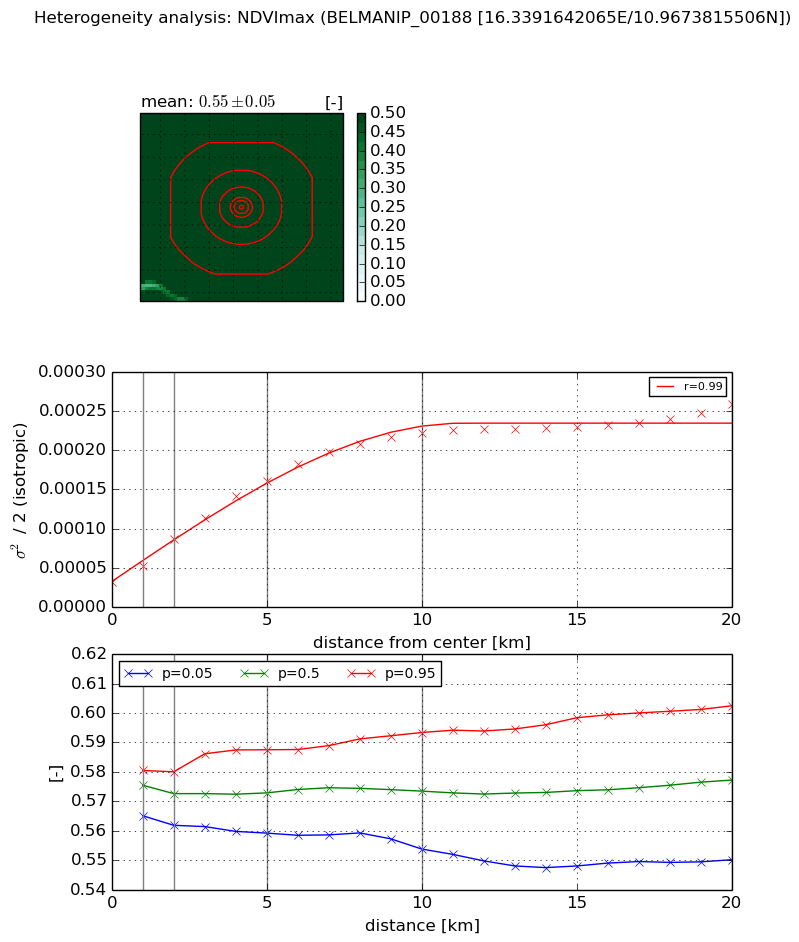
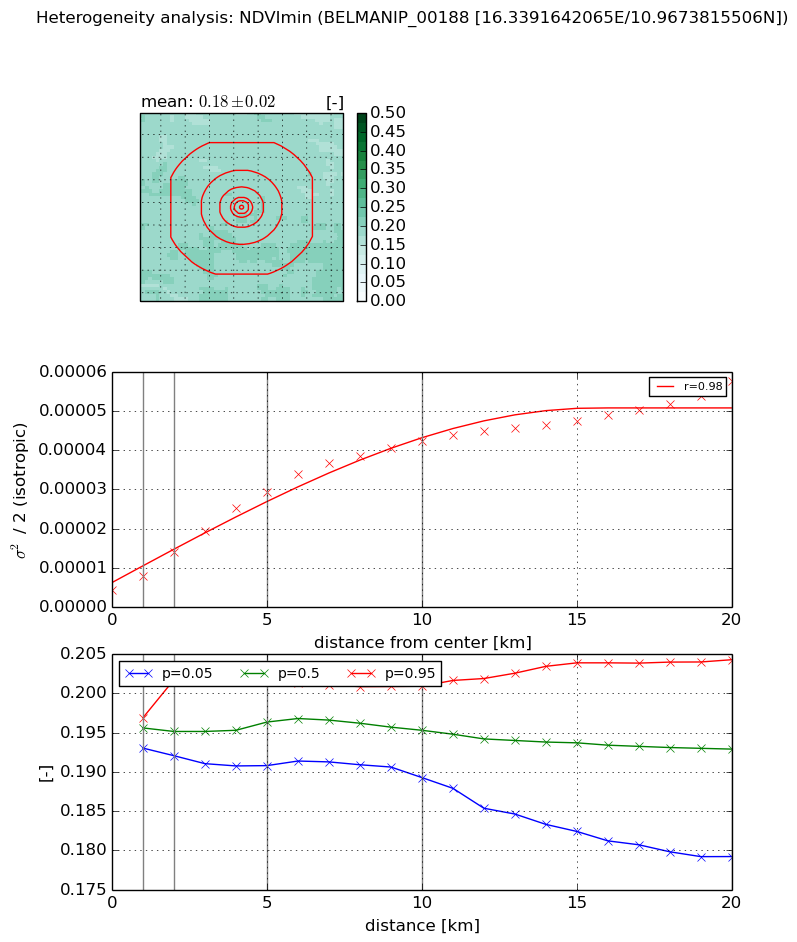
Heterogeneity analysis

The heterogeneity analysis provides information about the spatial and temporal heterogeneity of the site.

Topography


Roman et al. (2009) index


St

3.0054032861

Rcv

0.0562792148481

Rse

0.0

Rst

-0.633571910861

Rsv

-0.308351017036


Height range @ 1km [m]

4

Height range @ 2km [m]

4

Height range @ 5km [m]

4

Height range @ 10km [m]

-999

Height range @ 20km [m]

-999


Variance slope @ 1 km

0

Variance slope @ 2 km

0

Variance slope @ 5 km

0

Variance slope @ 10 km

-999

Variance slope @ 20 km

-999


NDVI (max. NDVI composite)


Roman et al. (2009) index


St

5.96524047485

Rcv

-0.00910251577095

Rse

0.0

Rst

-0.184203753829

Rsv

0.309607236176


NDVI range @ 1km [-]

0.02

NDVI range @ 2km [-]

0.02

NDVI range @ 5km [-]

0.03

NDVI range @ 10km [-]

0.04

NDVI range @ 20km [-]

0.05


Variance slope @ 1 km

2.11741235558e-05

Variance slope @ 2 km

2.71936523542e-05

Variance slope @ 5 km

2.6793119677e-05

Variance slope @ 10 km

1.9839215183e-05

Variance slope @ 20 km

9.50365320888e-06


NDVI (min. NDVI composite)I


Roman et al. (2009) index


St

2.04274774001e-07

Rcv

-0.0431610236843

Rse

0.0

Rst

0.38855616129

Rsv

14686100.7507


NDVI range @ 1km [-]

0.0

NDVI range @ 2km [-]

0.01

NDVI range @ 5km [-]

0.01

NDVI range @ 10km [-]

0.01

NDVI range @ 20km [-]

0.03


NDVI slope @ 1 km

3.64450503347e-06

NDVI slope @ 2 km

4.85652137654e-06

NDVI slope @ 5 km

5.229417139e-06

NDVI slope @ 10 km

3.98567713498e-06

NDVI slope @ 20 km

2.32974476248e-06


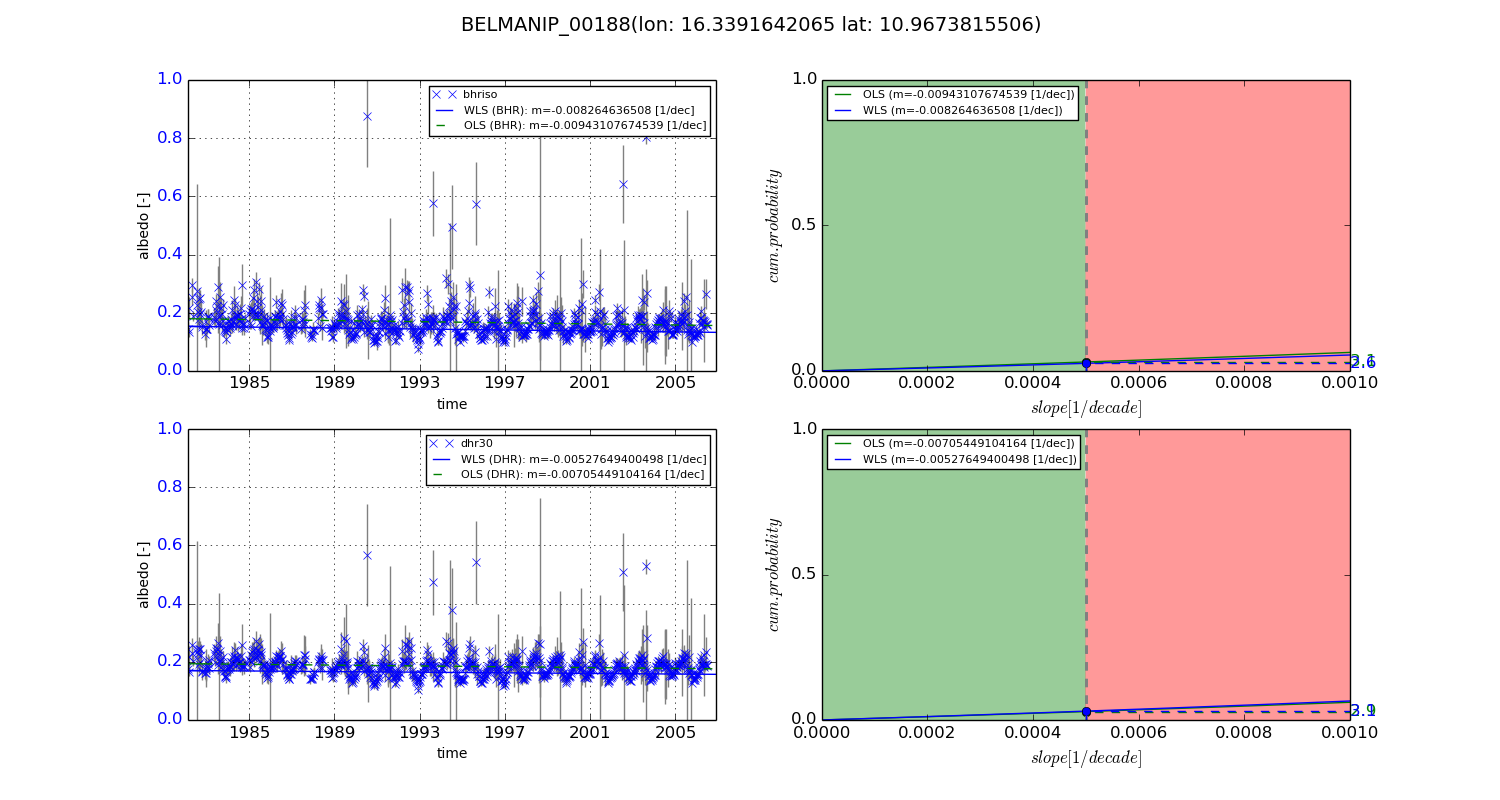
Temporal stability analysis

+000 deg (BHR)


BHR statistics

Temporal stability [1/decade]:


abs

rel


Weighted least square:

-0.008264636508


Ordinary least square:

-0.00943107674539


Probabilities that GCOS criteria is met:

Weighted least square:

2.6 %

Ordinary least square:

3.1 %


DHR statistics

Temporal stability [1/decade]:


abs

rel


Weighted least square:

-0.00527649400498


Ordinary least square:

-0.00705449104164


Probabilities that GCOS criteria is met:

Weighted least square:

3.1 %

Ordinary least square:

2.9 %


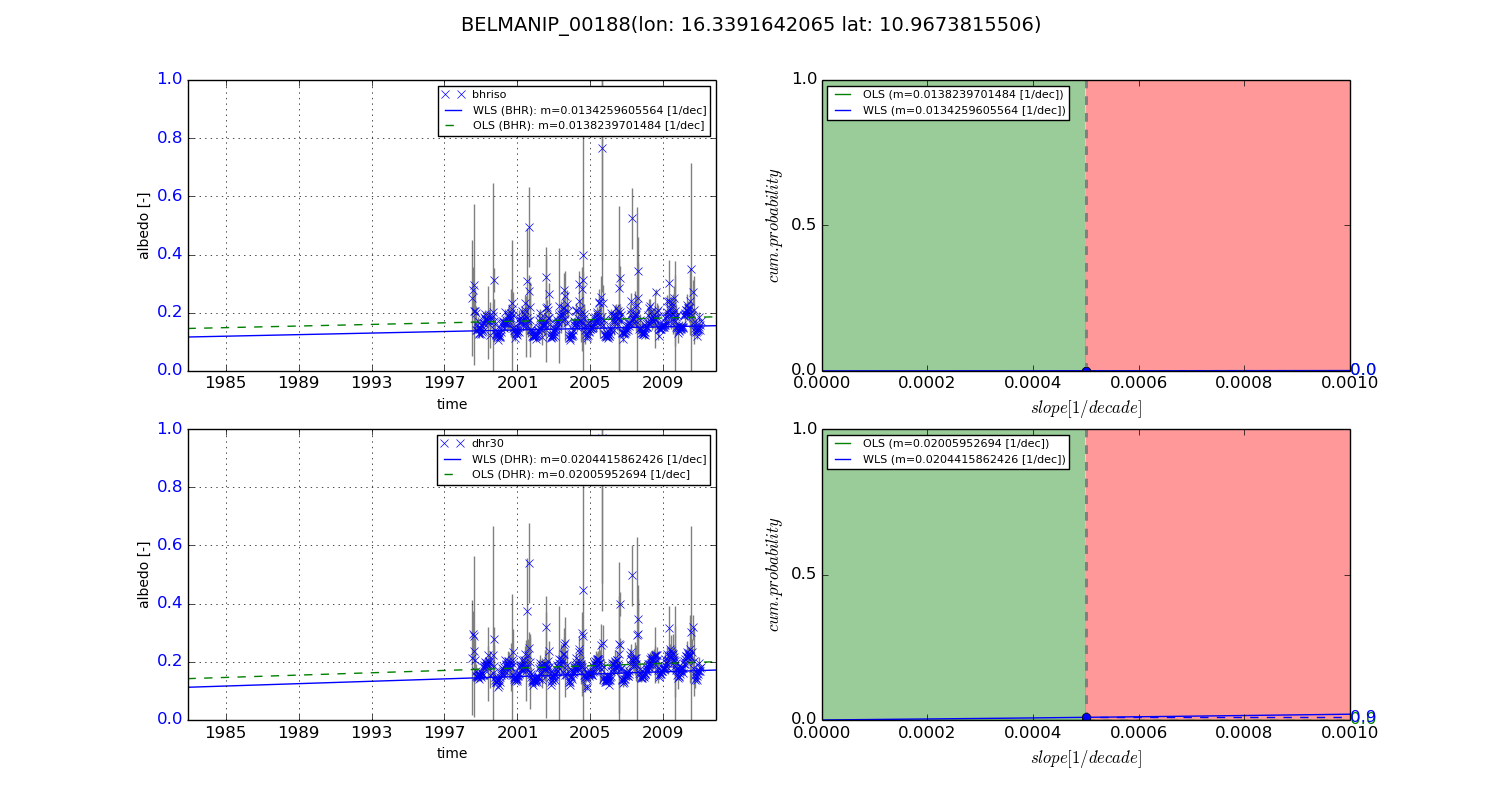
+057/+063 deg (BHR)


BHR statistics

Temporal stability [1/decade]:


abs

rel


Weighted least square:

0.0134259605564


Ordinary least square:

0.0138239701484


Probabilities that GCOS criteria is met:

Weighted least square:

0.0 %

Ordinary least square:

0.0 %


DHR statistics

Temporal stability [1/decade]:


abs

rel


Weighted least square:

0.0204415862426


Ordinary least square:

0.02005952694


Probabilities that GCOS criteria is met:

Weighted least square:

0.9 %

Ordinary least square:

0.0 %


Temporal anomaly analyis

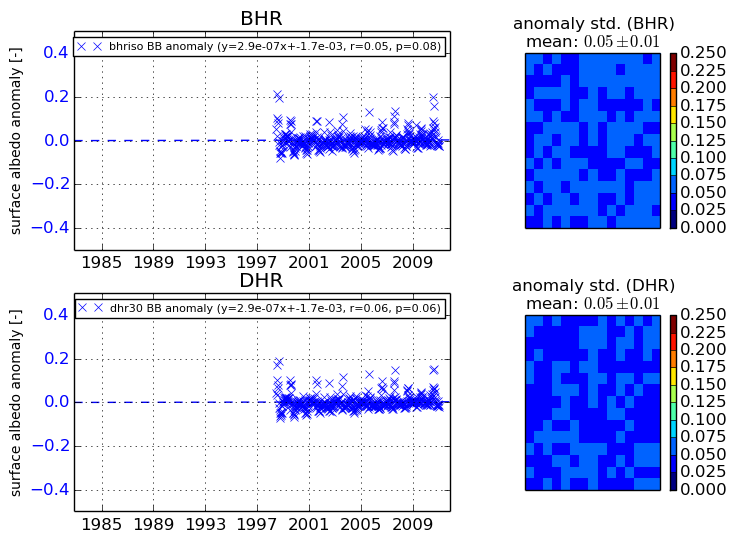
The variance of the temporal anomalies provides an additional measure about the stability of the signal AFTER removal of the mean seasonal cylce.
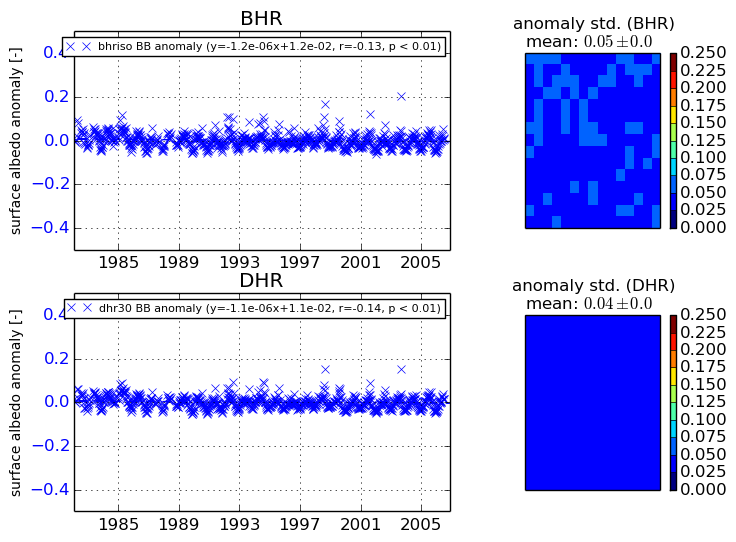
+000 deg


+057/+063 deg