BELMANIP_00189


Location

lon / lat [deg]: 20.3719 / 12.0236

Source network: BELMANIP


Geostationary surface albedo (GSA) data


“+000”


“+057/+063”


Landcover information (based on ESA CCI landcover data)


Landcover fractions @ 2km distance


Landcover fractions @ 20 km distance


Legend


Distance to open water bodies [km]:

55.01

Distance to urban areas [km]:

39.13


Radius: 1 km

Number of landcover classes:

3

Dominant landcover type:

10: cropland, rainfed

Fraction of dominant landcover type [%]:

91.0


Radius: 2 km

Number of landcover classes:

4

Dominant landcover type:

10: cropland, rainfed

Fraction of dominant landcover type [%]:

78.0


Radius: 5 km

Number of landcover classes:

4

Dominant landcover type:

10: cropland, rainfed

Fraction of dominant landcover type [%]:

70.0


Radius: 10 km

Number of landcover classes:

4

Dominant landcover type:

10: cropland, rainfed

Fraction of dominant landcover type [%]:

43.0


Radius: 20 km

Number of landcover classes:

4

Dominant landcover type:

30: mosaic cropland (>50%), natural veg. (< 50%)

Fraction of dominant landcover type [%]:

47.0


Disturbances


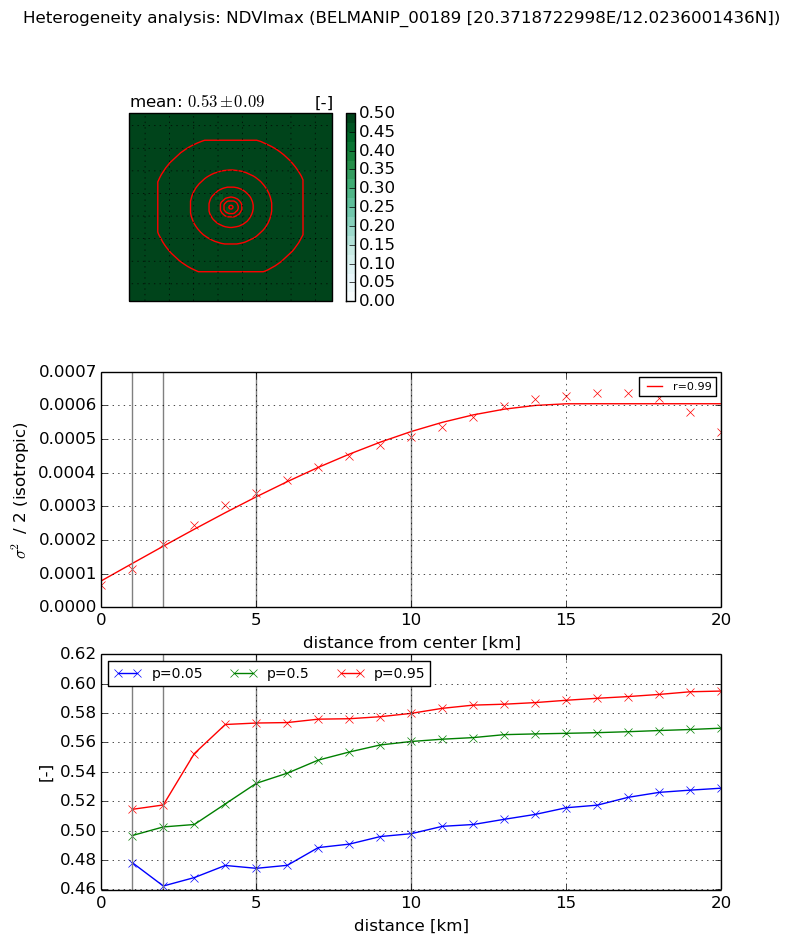
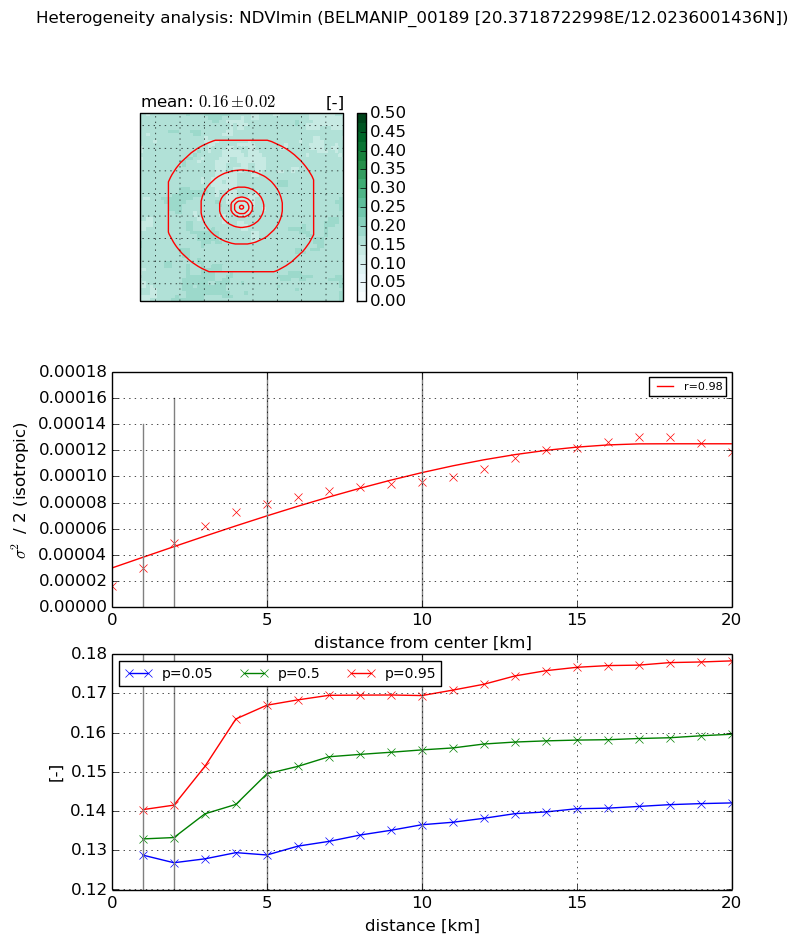
Heterogeneity analysis

The heterogeneity analysis provides information about the spatial and temporal heterogeneity of the site.

Topography


Roman et al. (2009) index


St

5.10819758759

Rcv

-0.0573034591024

Rse

0.0

Rst

-0.0536808515296

Rsv

0.476306989001


Height range @ 1km [m]

15

Height range @ 2km [m]

17

Height range @ 5km [m]

17

Height range @ 10km [m]

-999

Height range @ 20km [m]

-999


Variance slope @ 1 km

6

Variance slope @ 2 km

7

Variance slope @ 5 km

5

Variance slope @ 10 km

-999

Variance slope @ 20 km

-999


NDVI (max. NDVI composite)


Roman et al. (2009) index


St

nan

Rcv

nan

Rse

nan

Rst

nan

Rsv

nan


NDVI range @ 1km [-]

0.04

NDVI range @ 2km [-]

0.06

NDVI range @ 5km [-]

0.1

NDVI range @ 10km [-]

0.08

NDVI range @ 20km [-]

0.07


Variance slope @ 1 km

4.85456113838e-05

Variance slope @ 2 km

6.11134887485e-05

Variance slope @ 5 km

5.67688967706e-05

Variance slope @ 10 km

4.44632575962e-05

Variance slope @ 20 km

2.62684266875e-05


NDVI (min. NDVI composite)I


Roman et al. (2009) index


St

nan

Rcv

nan

Rse

nan

Rst

nan

Rsv

nan


NDVI range @ 1km [-]

0.01

NDVI range @ 2km [-]

0.01

NDVI range @ 5km [-]

0.04

NDVI range @ 10km [-]

0.03

NDVI range @ 20km [-]

0.04


NDVI slope @ 1 km

1.3229514523e-05

NDVI slope @ 2 km

1.62737189755e-05

NDVI slope @ 5 km

1.30175875909e-05

NDVI slope @ 10 km

7.71886102893e-06

NDVI slope @ 20 km

4.9354597872e-06


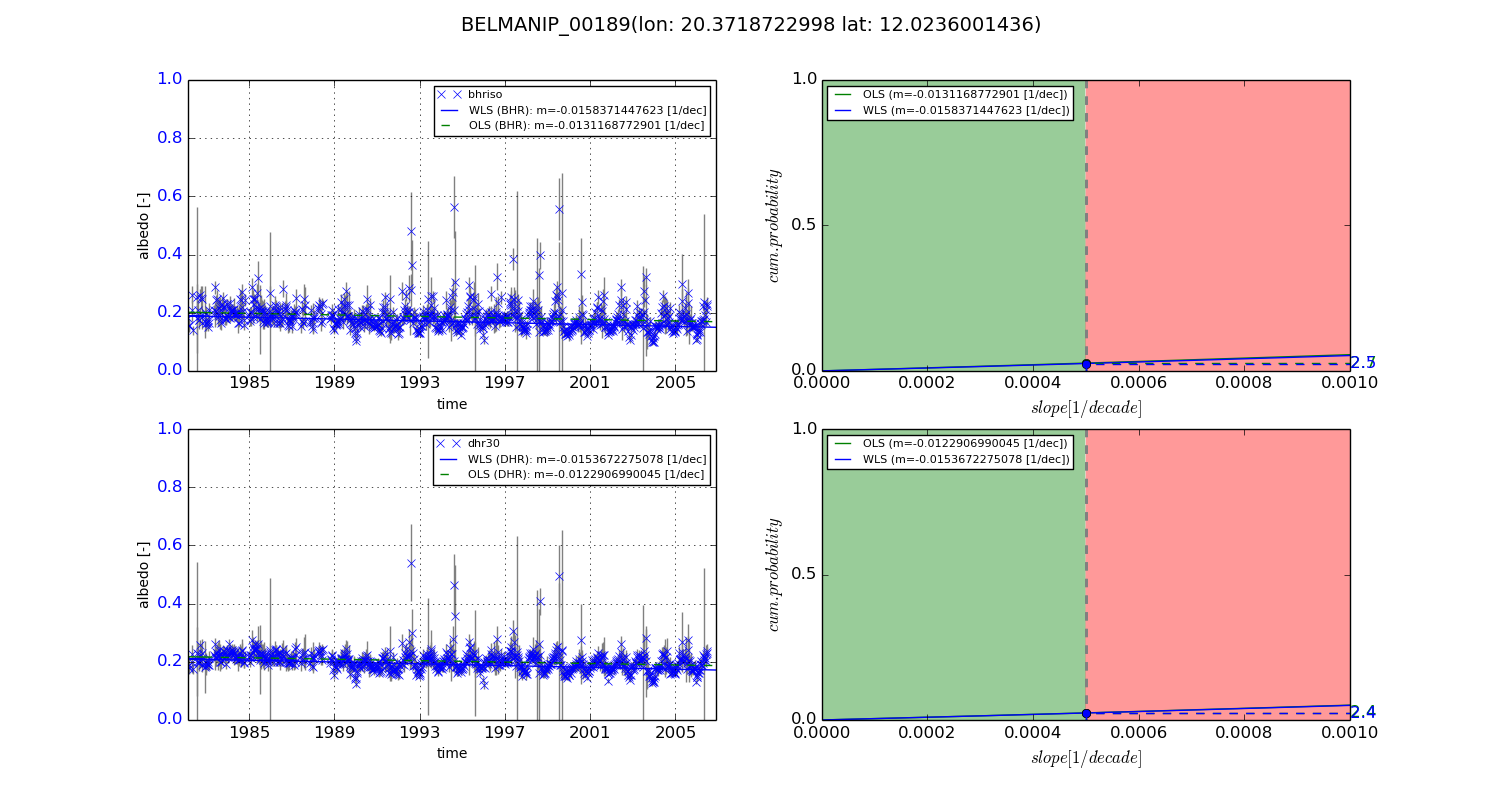
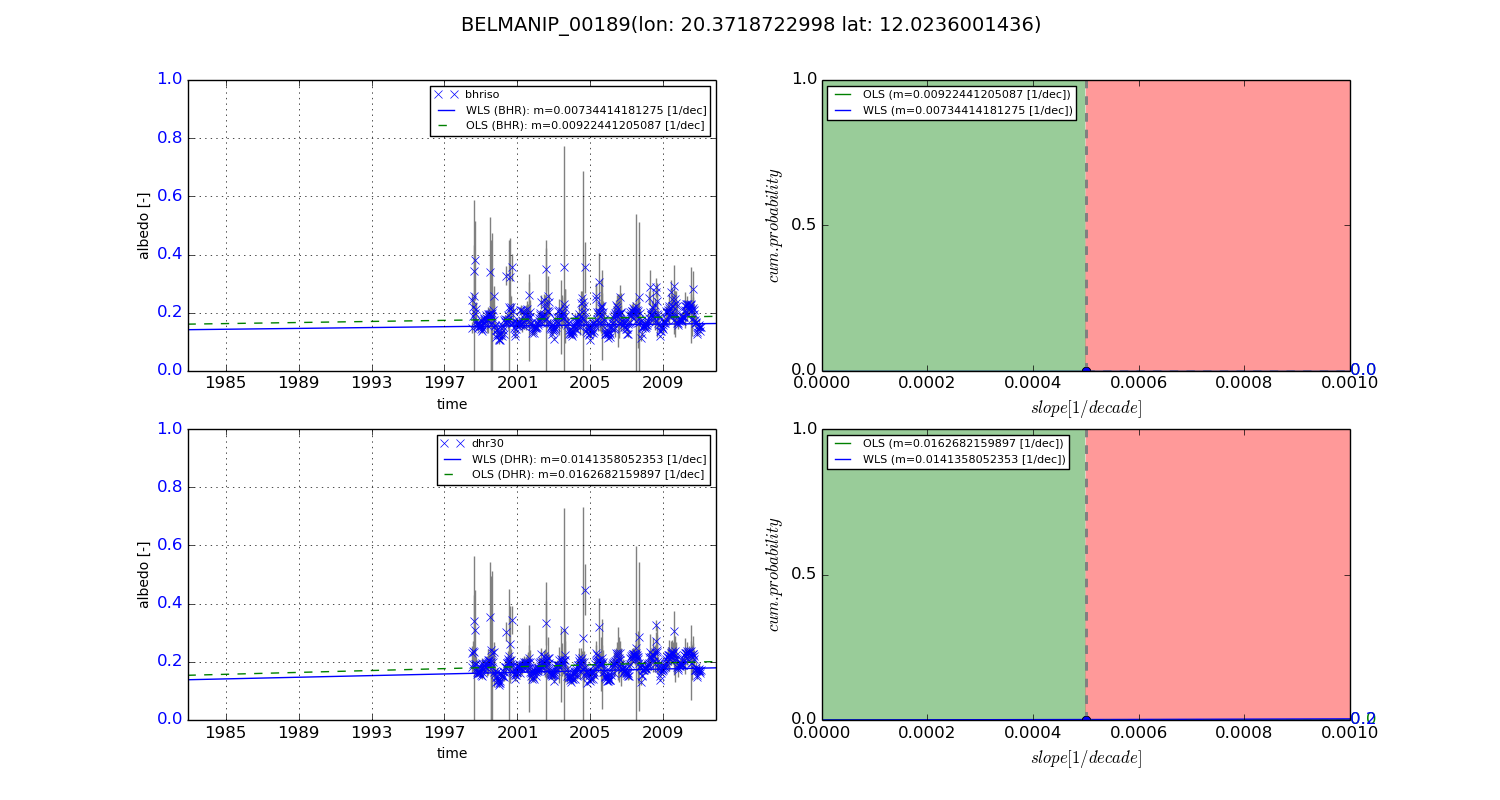
Temporal stability analysis

+000 deg (BHR)


BHR statistics

Temporal stability [1/decade]:


abs

rel


Weighted least square:

-0.0158371447623


Ordinary least square:

-0.0131168772901


Probabilities that GCOS criteria is met:

Weighted least square:

2.5 %

Ordinary least square:

2.7 %


DHR statistics

Temporal stability [1/decade]:


abs

rel


Weighted least square:

-0.0153672275078


Ordinary least square:

-0.0122906990045


Probabilities that GCOS criteria is met:

Weighted least square:

2.4 %

Ordinary least square:

2.4 %


+057/+063 deg (BHR)


BHR statistics

Temporal stability [1/decade]:


abs

rel


Weighted least square:

0.00734414181275


Ordinary least square:

0.00922441205087


Probabilities that GCOS criteria is met:

Weighted least square:

0.0 %

Ordinary least square:

0.0 %


DHR statistics

Temporal stability [1/decade]:


abs

rel


Weighted least square:

0.0141358052353


Ordinary least square:

0.0162682159897


Probabilities that GCOS criteria is met:

Weighted least square:

0.2 %

Ordinary least square:

0.0 %


Temporal anomaly analyis

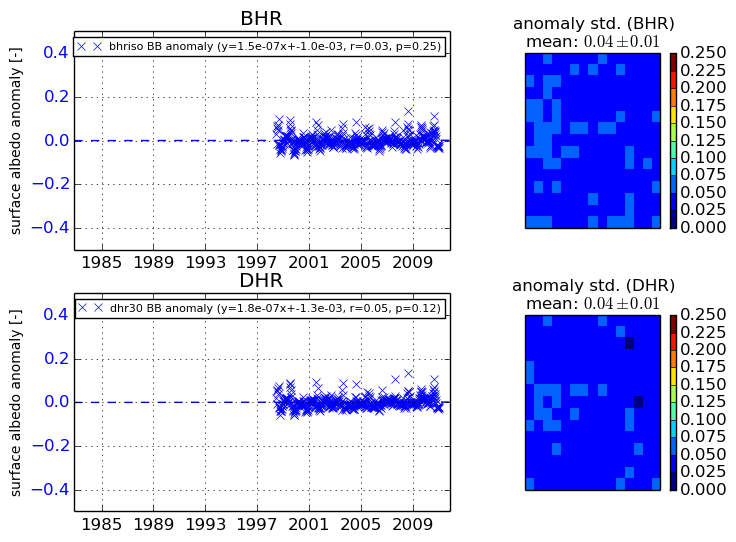
The variance of the temporal anomalies provides an additional measure about the stability of the signal AFTER removal of the mean seasonal cylce.
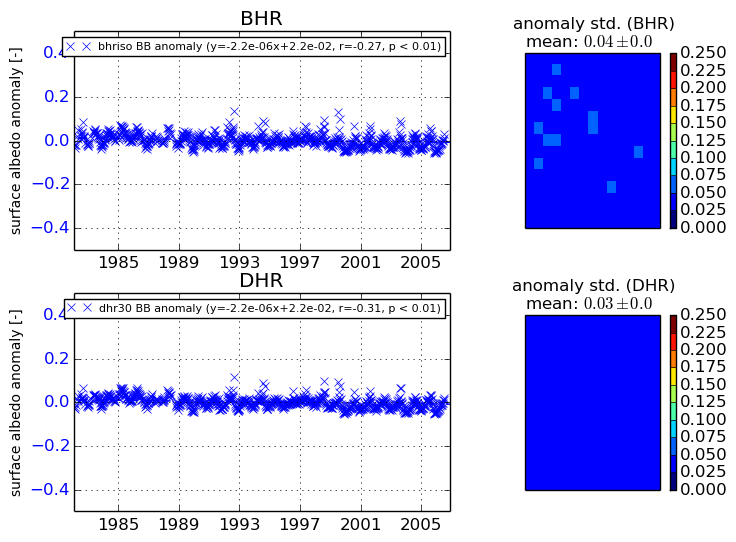
+000 deg


+057/+063 deg