BELMANIP_00222


Location

lon / lat [deg]: 42.7937 / 22.2416

Source network: BELMANIP


Geostationary surface albedo (GSA) data


“+000”


“+057/+063”


Landcover information (based on ESA CCI landcover data)


Landcover fractions @ 2km distance


Landcover fractions @ 20 km distance


Legend


Distance to open water bodies [km]:

60.21

Distance to urban areas [km]:

none in region


Radius: 1 km

Number of landcover classes:

1

Dominant landcover type:

200: bare areas

Fraction of dominant landcover type [%]:

100.0


Radius: 2 km

Number of landcover classes:

1

Dominant landcover type:

200: bare areas

Fraction of dominant landcover type [%]:

100.0


Radius: 5 km

Number of landcover classes:

1

Dominant landcover type:

200: bare areas

Fraction of dominant landcover type [%]:

100.0


Radius: 10 km

Number of landcover classes:

1

Dominant landcover type:

200: bare areas

Fraction of dominant landcover type [%]:

100.0


Radius: 20 km

Number of landcover classes:

1

Dominant landcover type:

200: bare areas

Fraction of dominant landcover type [%]:

100.0


Disturbances


Heterogeneity analysis

The heterogeneity analysis provides information about the spatial and temporal heterogeneity of the site.

Topography


Roman et al. (2009) index


St

9.89445000475e-05

Rcv

0.366561588676

Rse

0.0

Rst

0.000337651637632

Rsv

30319.6609806


Height range @ 1km [m]

7

Height range @ 2km [m]

7

Height range @ 5km [m]

11

Height range @ 10km [m]

-999

Height range @ 20km [m]

-999


Variance slope @ 1 km

1

Variance slope @ 2 km

0

Variance slope @ 5 km

1

Variance slope @ 10 km

-999

Variance slope @ 20 km

-999


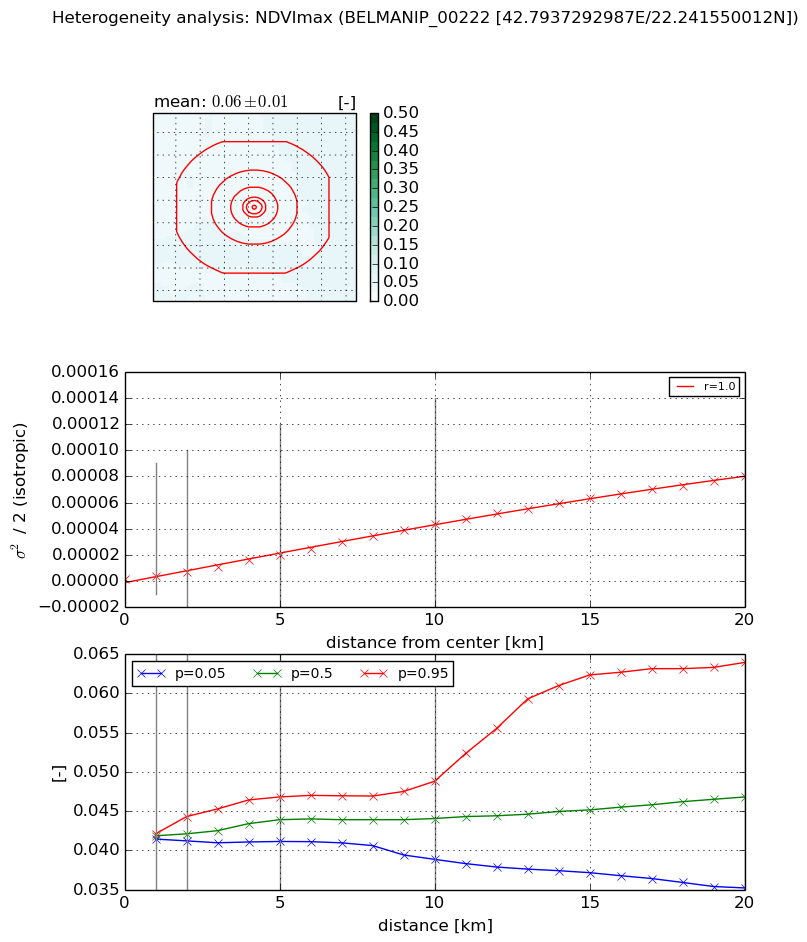
NDVI (max. NDVI composite)


Roman et al. (2009) index


St

10.6045048769

Rcv

0.232153353956

Rse

0.0

Rst

0.00134288649839

Rsv

-0.0494023988335


NDVI range @ 1km [-]

0.0

NDVI range @ 2km [-]

0.0

NDVI range @ 5km [-]

0.01

NDVI range @ 10km [-]

0.01

NDVI range @ 20km [-]

0.03


Variance slope @ 1 km

1.76138327955e-06

Variance slope @ 2 km

2.71379066732e-06

Variance slope @ 5 km

3.80249494897e-06

Variance slope @ 10 km

4.39309005259e-06

Variance slope @ 20 km

4.11025513489e-06


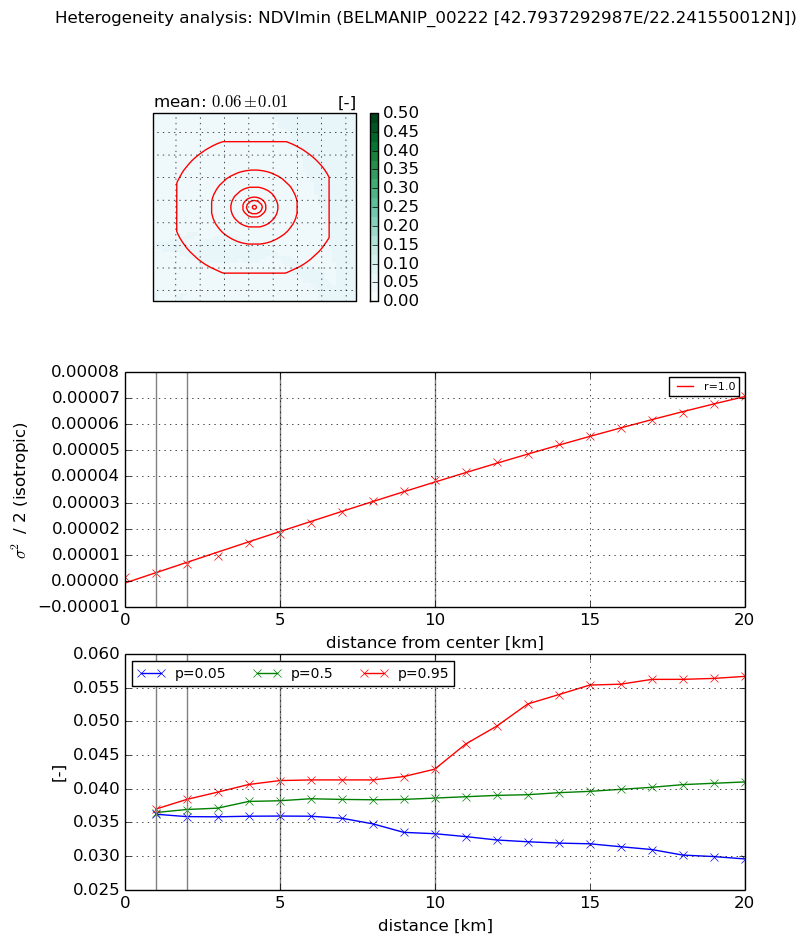
NDVI (min. NDVI composite)I


Roman et al. (2009) index


St

7.12049138999

Rcv

0.318487382963

Rse

0.0

Rst

-0.0237096583127

Rsv

0.079122195795


NDVI range @ 1km [-]

0.0

NDVI range @ 2km [-]

0.0

NDVI range @ 5km [-]

0.01

NDVI range @ 10km [-]

0.01

NDVI range @ 20km [-]

0.03


NDVI slope @ 1 km

1.60692349377e-06

NDVI slope @ 2 km

2.45863864338e-06

NDVI slope @ 5 km

3.39022319421e-06

NDVI slope @ 10 km

3.85075806015e-06

NDVI slope @ 20 km

3.60183163162e-06


Temporal stability analysis

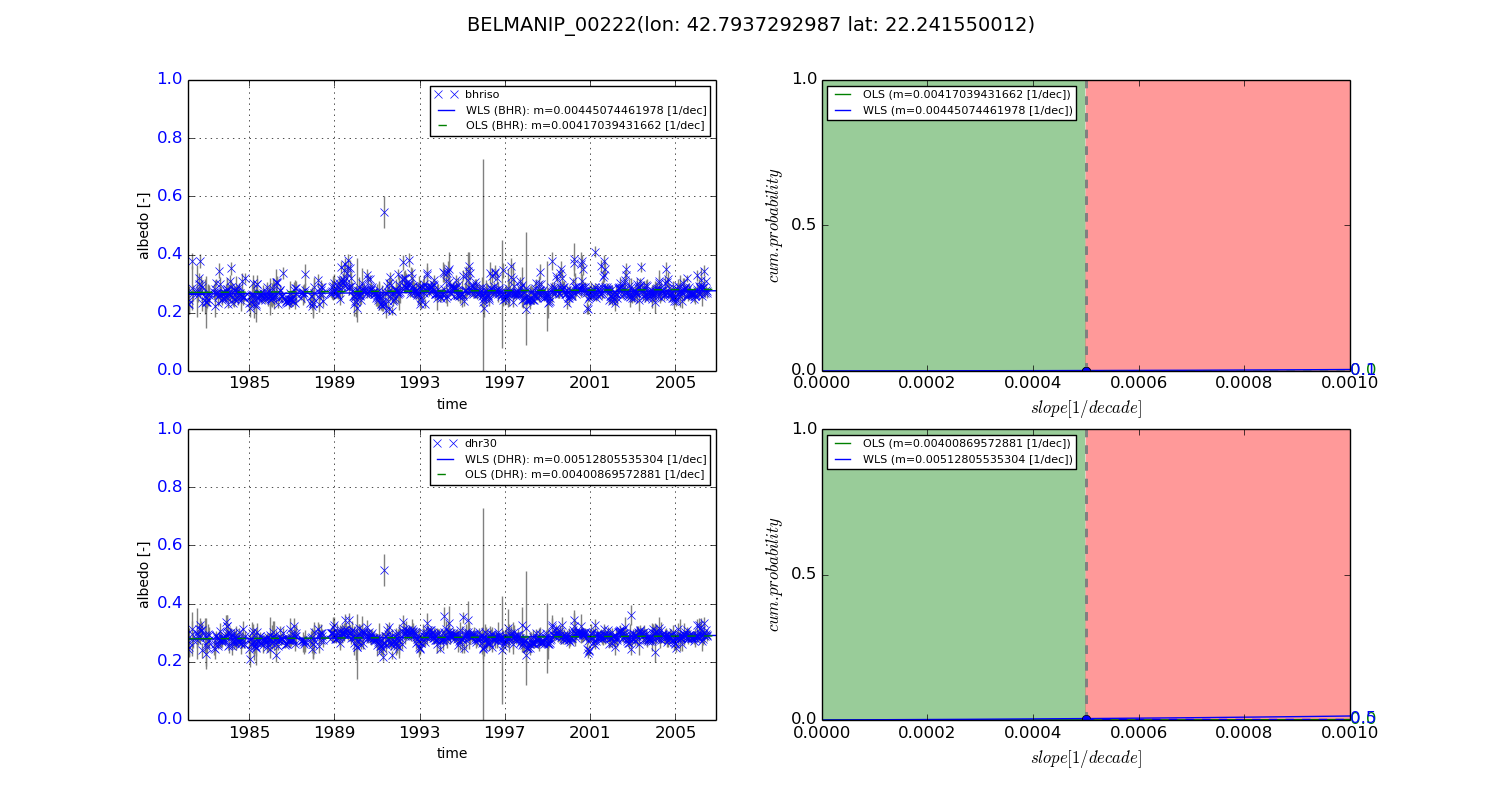
+000 deg (BHR)


BHR statistics

Temporal stability [1/decade]:


abs

rel


Weighted least square:

0.00445074461978


Ordinary least square:

0.00417039431662


Probabilities that GCOS criteria is met:

Weighted least square:

0.1 %

Ordinary least square:

0.0 %


DHR statistics

Temporal stability [1/decade]:


abs

rel


Weighted least square:

0.00512805535304


Ordinary least square:

0.00400869572881


Probabilities that GCOS criteria is met:

Weighted least square:

0.5 %

Ordinary least square:

0.0 %


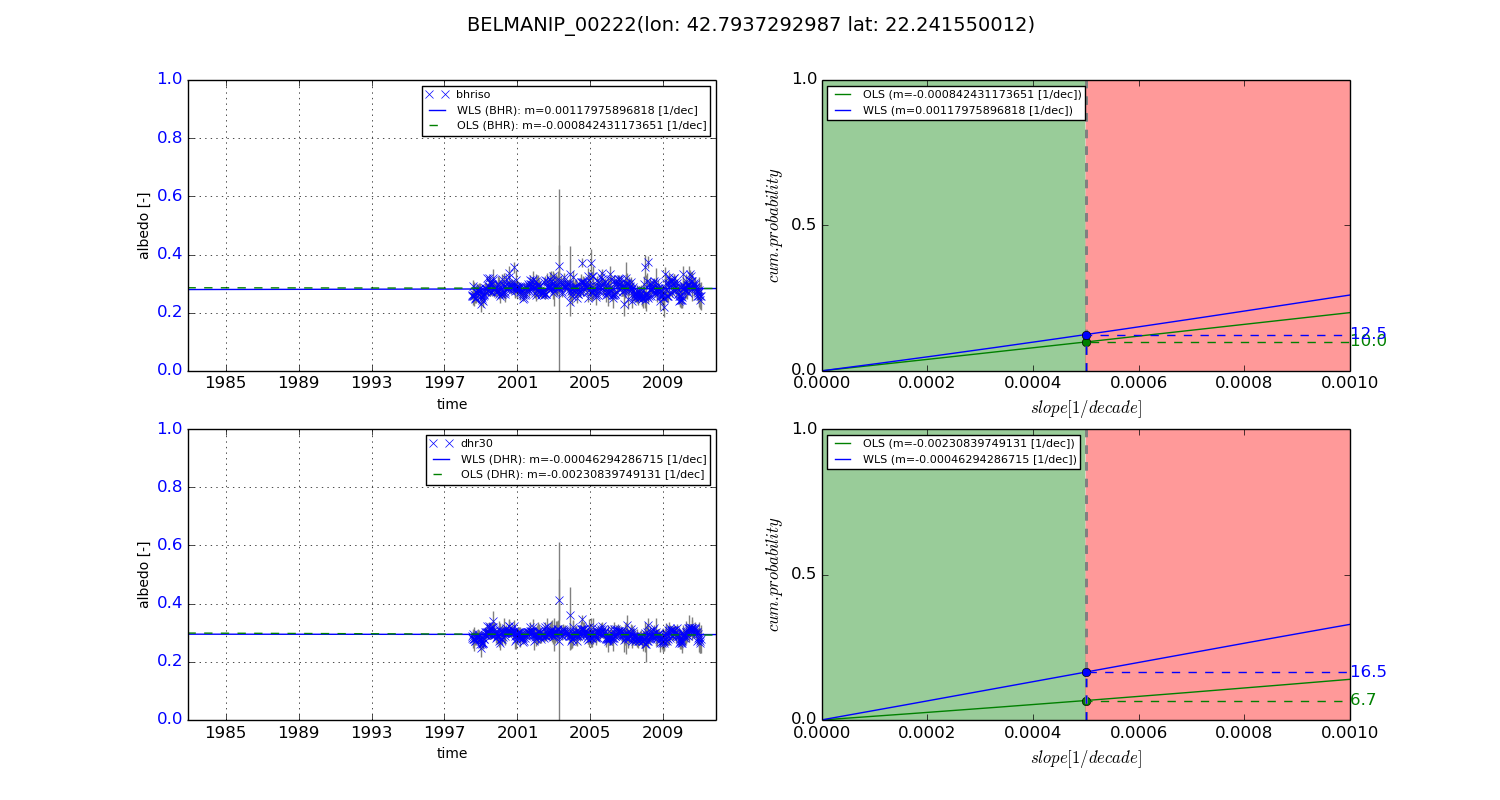
+057/+063 deg (BHR)


BHR statistics

Temporal stability [1/decade]:


abs

rel


Weighted least square:

0.00117975896818


Ordinary least square:

-0.000842431173651


Probabilities that GCOS criteria is met:

Weighted least square:

12.5 %

Ordinary least square:

10.0 %


DHR statistics

Temporal stability [1/decade]:


abs

rel


Weighted least square:

-0.00046294286715


Ordinary least square:

-0.00230839749131


Probabilities that GCOS criteria is met:

Weighted least square:

16.5 %

Ordinary least square:

6.7 %


Temporal anomaly analyis

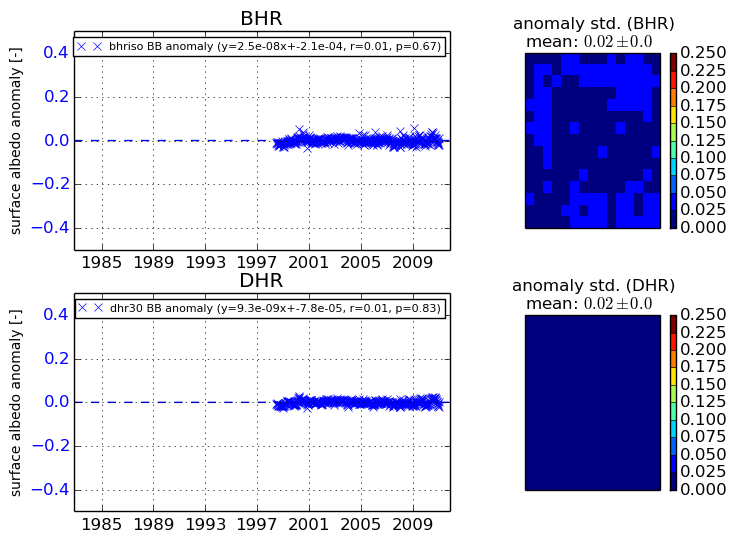
The variance of the temporal anomalies provides an additional measure about the stability of the signal AFTER removal of the mean seasonal cylce.
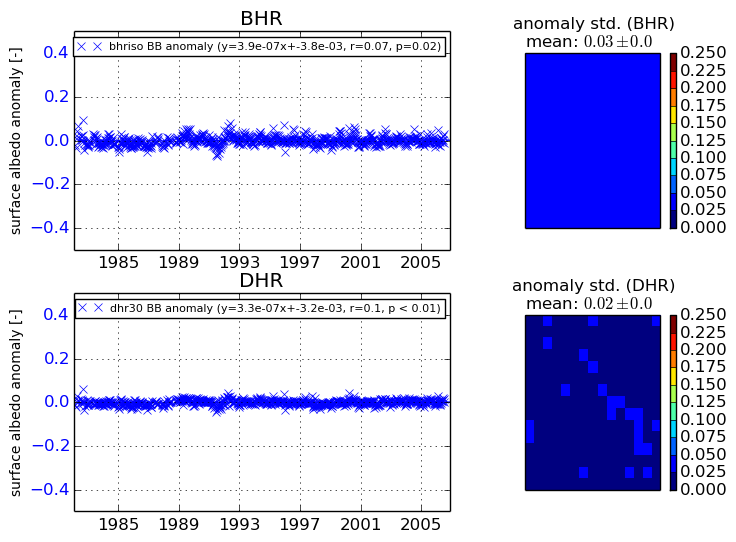
+000 deg


+057/+063 deg