BELMANIP_00228


Location

lon / lat [deg]: -7.3732 / 30.4309

Source network: BELMANIP


Geostationary surface albedo (GSA) data


“+000”


“+057/+063”


Landcover information (based on ESA CCI landcover data)


Landcover fractions @ 2km distance


Landcover fractions @ 20 km distance


Legend


Distance to open water bodies [km]:

22.27

Distance to urban areas [km]:

68.62


Radius: 1 km

Number of landcover classes:

1

Dominant landcover type:

200: bare areas

Fraction of dominant landcover type [%]:

100.0


Radius: 2 km

Number of landcover classes:

1

Dominant landcover type:

200: bare areas

Fraction of dominant landcover type [%]:

100.0


Radius: 5 km

Number of landcover classes:

2

Dominant landcover type:

200: bare areas

Fraction of dominant landcover type [%]:

95.0


Radius: 10 km

Number of landcover classes:

2

Dominant landcover type:

200: bare areas

Fraction of dominant landcover type [%]:

72.0


Radius: 20 km

Number of landcover classes:

3

Dominant landcover type:

150: Sparse vegetation (tree, shrub, herbaceous cover) (<15%)

Fraction of dominant landcover type [%]:

51.0


Disturbances


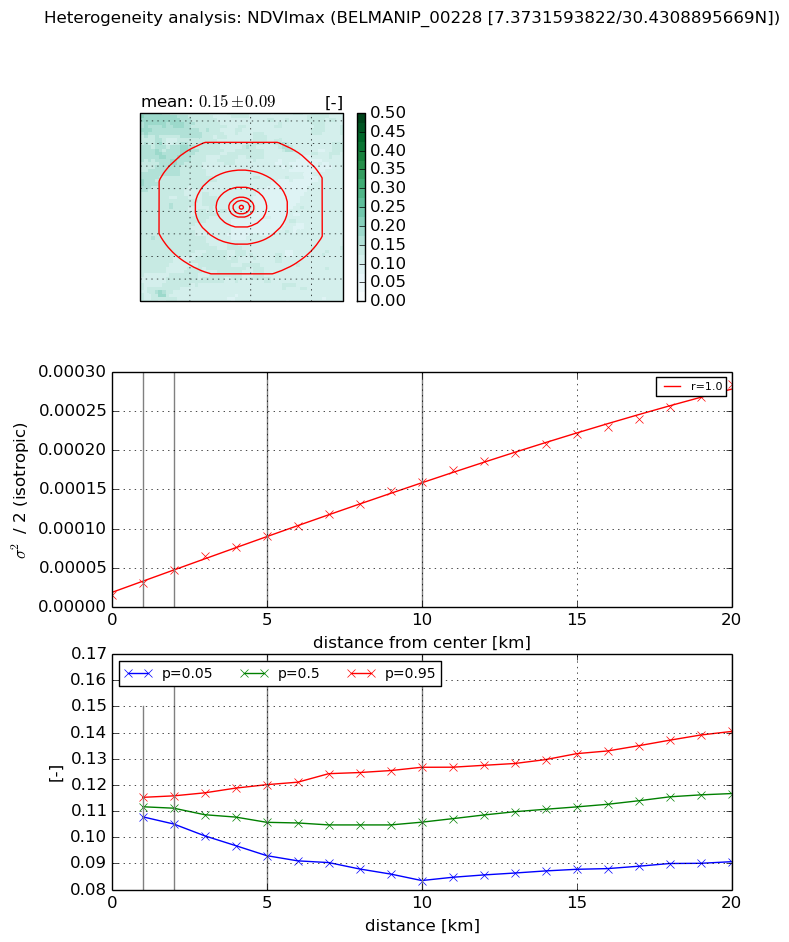
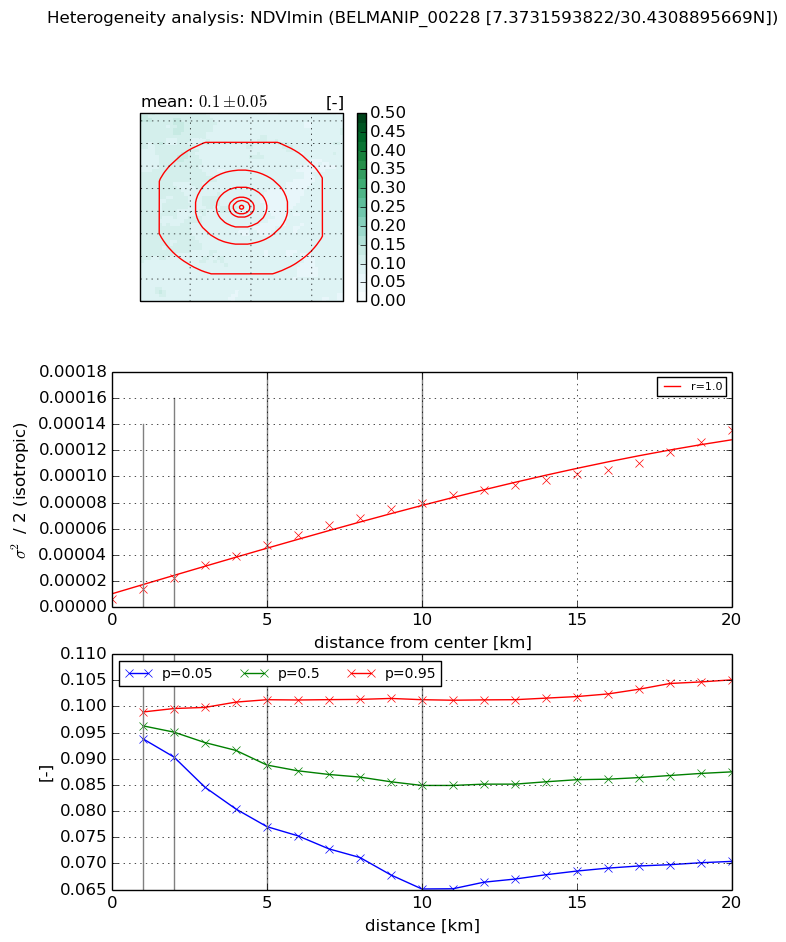
Heterogeneity analysis

The heterogeneity analysis provides information about the spatial and temporal heterogeneity of the site.

Topography


Roman et al. (2009) index


St

1.41081227084

Rcv

1.13004688815

Rse

0.0

Rst

0.0

Rsv

-0.996387692846


Height range @ 1km [m]

20

Height range @ 2km [m]

35

Height range @ 5km [m]

105

Height range @ 10km [m]

-999

Height range @ 20km [m]

-999


Variance slope @ 1 km

190

Variance slope @ 2 km

248

Variance slope @ 5 km

323

Variance slope @ 10 km

-999

Variance slope @ 20 km

-999


NDVI (max. NDVI composite)


Roman et al. (2009) index


St

3.58576125523

Rcv

0.666463807722

Rse

0.0

Rst

-1.87797004608e-08

Rsv

-0.170178600716


NDVI range @ 1km [-]

0.01

NDVI range @ 2km [-]

0.01

NDVI range @ 5km [-]

0.03

NDVI range @ 10km [-]

0.04

NDVI range @ 20km [-]

0.05


Variance slope @ 1 km

1.62586932797e-05

Variance slope @ 2 km

1.6186857214e-05

Variance slope @ 5 km

1.50835273373e-05

Variance slope @ 10 km

1.43250922263e-05

Variance slope @ 20 km

1.30801352848e-05


NDVI (min. NDVI composite)I


Roman et al. (2009) index


St

3.58785843358

Rcv

0.542995376856

Rse

0.0

Rst

-5.23024598463e-08

Rsv

-0.293157963048


NDVI range @ 1km [-]

0.01

NDVI range @ 2km [-]

0.01

NDVI range @ 5km [-]

0.02

NDVI range @ 10km [-]

0.04

NDVI range @ 20km [-]

0.03


NDVI slope @ 1 km

7.54841624741e-06

NDVI slope @ 2 km

7.8590473019e-06

NDVI slope @ 5 km

8.35840401774e-06

NDVI slope @ 10 km

7.52967079887e-06

NDVI slope @ 20 km

5.99061564368e-06


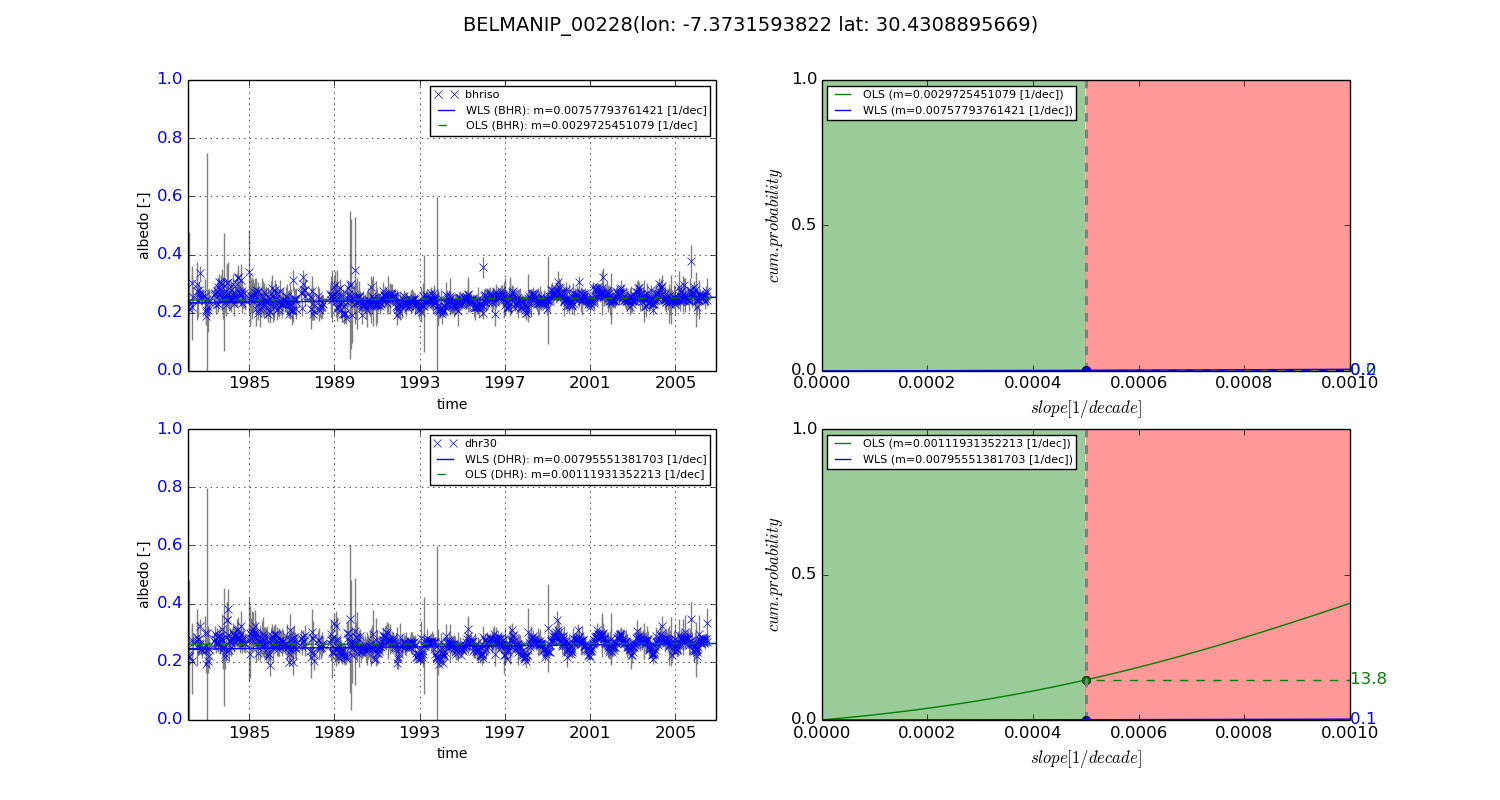
Temporal stability analysis

+000 deg (BHR)


BHR statistics

Temporal stability [1/decade]:


abs

rel


Weighted least square:

0.00757793761421


Ordinary least square:

0.0029725451079


Probabilities that GCOS criteria is met:

Weighted least square:

0.2 %

Ordinary least square:

0.0 %


DHR statistics

Temporal stability [1/decade]:


abs

rel


Weighted least square:

0.00795551381703


Ordinary least square:

0.00111931352213


Probabilities that GCOS criteria is met:

Weighted least square:

0.1 %

Ordinary least square:

13.8 %


+057/+063 deg (BHR)


BHR statistics

Temporal stability [1/decade]:


abs

rel


Weighted least square:

-99999.0


Ordinary least square:

-99999.0


Probabilities that GCOS criteria is met:

Weighted least square:

-99999.0 %

Ordinary least square:

-99999.0 %


DHR statistics

Temporal stability [1/decade]:


abs

rel


Weighted least square:

-99999.0


Ordinary least square:

-99999.0


Probabilities that GCOS criteria is met:

Weighted least square:

-99999.0 %

Ordinary least square:

-99999.0 %


Temporal anomaly analyis

The variance of the temporal anomalies provides an additional measure about the stability of the signal AFTER removal of the mean seasonal cylce.
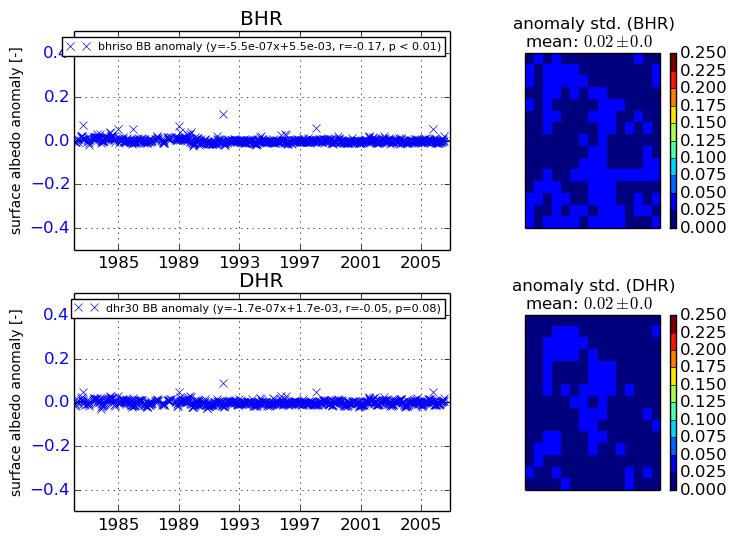
+000 deg


+057/+063 deg