BELMANIP_00253


Location

lon / lat [deg]: 33.3209 / 47.0995

Source network: BELMANIP


Geostationary surface albedo (GSA) data


“+000”


“+057/+063”


Landcover information (based on ESA CCI landcover data)


Landcover fractions @ 2km distance


Landcover fractions @ 20 km distance


Legend


Distance to open water bodies [km]:

21.13

Distance to urban areas [km]:

14.19


Radius: 1 km

Number of landcover classes:

1

Dominant landcover type:

10: cropland, rainfed

Fraction of dominant landcover type [%]:

100.0


Radius: 2 km

Number of landcover classes:

1

Dominant landcover type:

10: cropland, rainfed

Fraction of dominant landcover type [%]:

99.0


Radius: 5 km

Number of landcover classes:

1

Dominant landcover type:

10: cropland, rainfed

Fraction of dominant landcover type [%]:

100.0


Radius: 10 km

Number of landcover classes:

1

Dominant landcover type:

10: cropland, rainfed

Fraction of dominant landcover type [%]:

100.0


Radius: 20 km

Number of landcover classes:

1

Dominant landcover type:

10: cropland, rainfed

Fraction of dominant landcover type [%]:

99.0


Disturbances


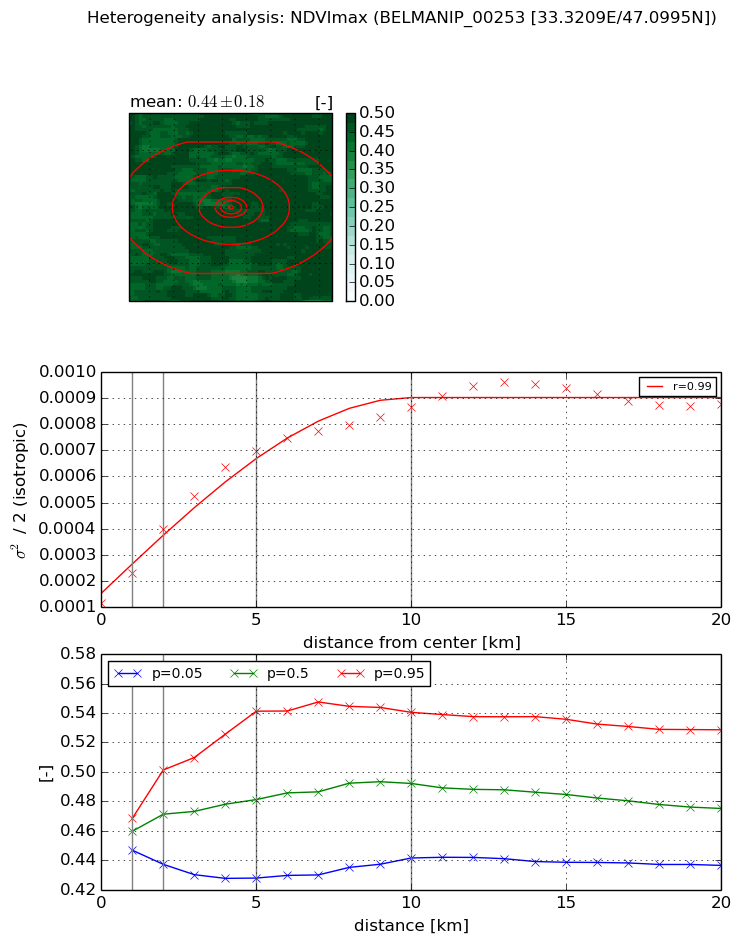
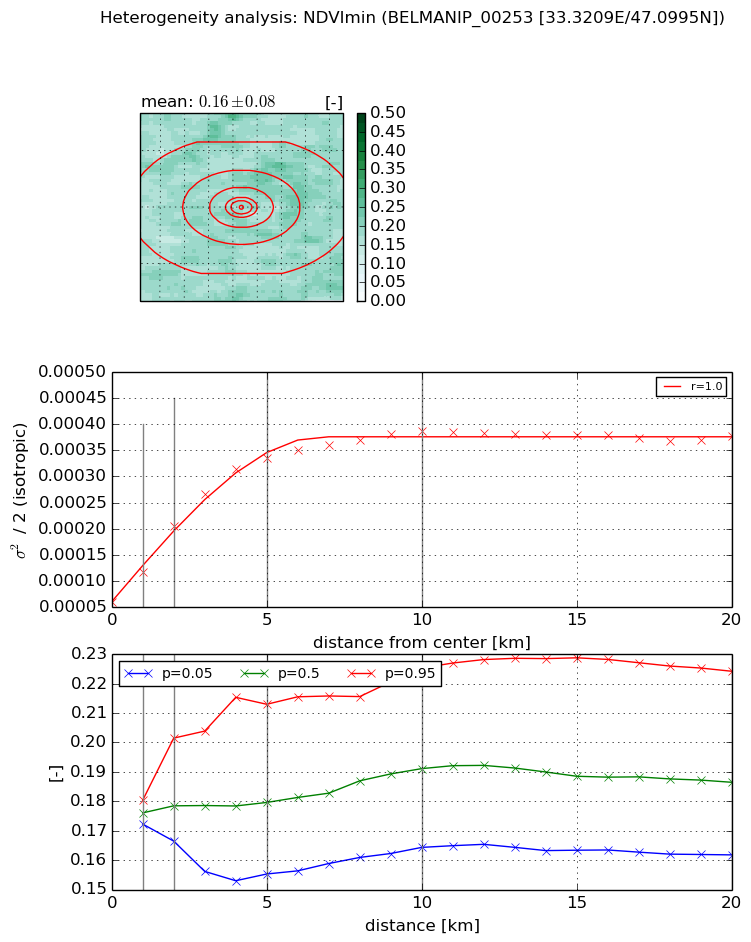
Heterogeneity analysis

The heterogeneity analysis provides information about the spatial and temporal heterogeneity of the site.

Topography


Roman et al. (2009) index


St

0.628485655197

Rcv

0.231021960242

Rse

0.0

Rst

0.00987870778692

Rsv

4.53247796869


Height range @ 1km [m]

3

Height range @ 2km [m]

4

Height range @ 5km [m]

7

Height range @ 10km [m]

-999

Height range @ 20km [m]

-999


Variance slope @ 1 km

1

Variance slope @ 2 km

1

Variance slope @ 5 km

0

Variance slope @ 10 km

-999

Variance slope @ 20 km

-999


NDVI (max. NDVI composite)


Roman et al. (2009) index


St

4.54143927943

Rcv

0.221857793114

Rse

0.0

Rst

-0.0677901097072

Rsv

0.370935629274


NDVI range @ 1km [-]

0.02

NDVI range @ 2km [-]

0.06

NDVI range @ 5km [-]

0.11

NDVI range @ 10km [-]

0.1

NDVI range @ 20km [-]

0.09


Variance slope @ 1 km

0.000116112366913

Variance slope @ 2 km

0.000142047673599

Variance slope @ 5 km

0.000121149216468

Variance slope @ 10 km

7.21418148238e-05

Variance slope @ 20 km

3.16838735453e-05


NDVI (min. NDVI composite)I


Roman et al. (2009) index


St

21.6701935147

Rcv

0.0527730585801

Rse

0.0

Rst

-0.00014923466896

Rsv

0.0855167104434


NDVI range @ 1km [-]

0.01

NDVI range @ 2km [-]

0.04

NDVI range @ 5km [-]

0.06

NDVI range @ 10km [-]

0.06

NDVI range @ 20km [-]

0.06


NDVI slope @ 1 km

5.7970287571e-05

NDVI slope @ 2 km

7.22221052573e-05

NDVI slope @ 5 km

5.77719134181e-05

NDVI slope @ 10 km

3.09438203043e-05

NDVI slope @ 20 km

1.0814296575e-05


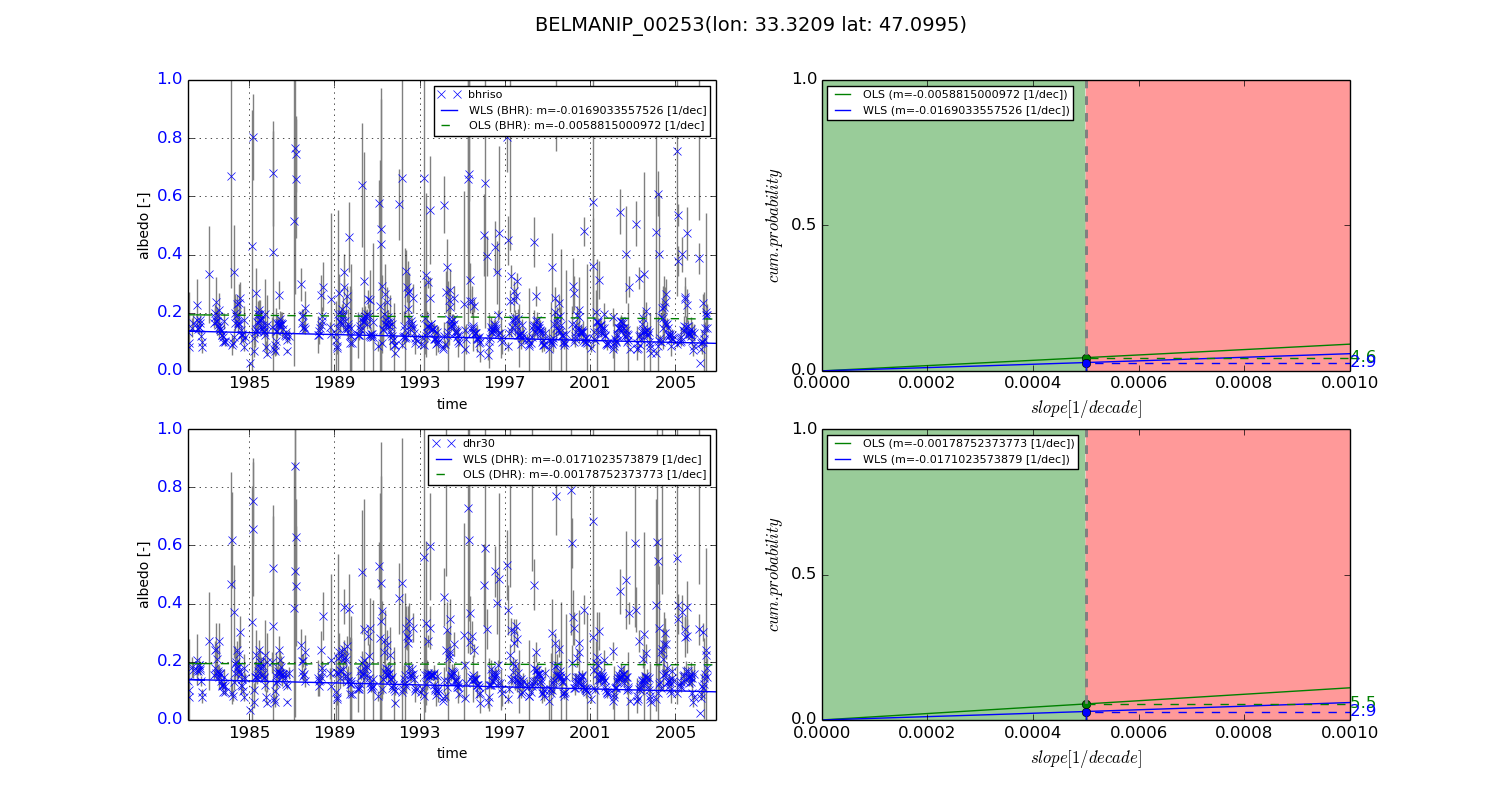
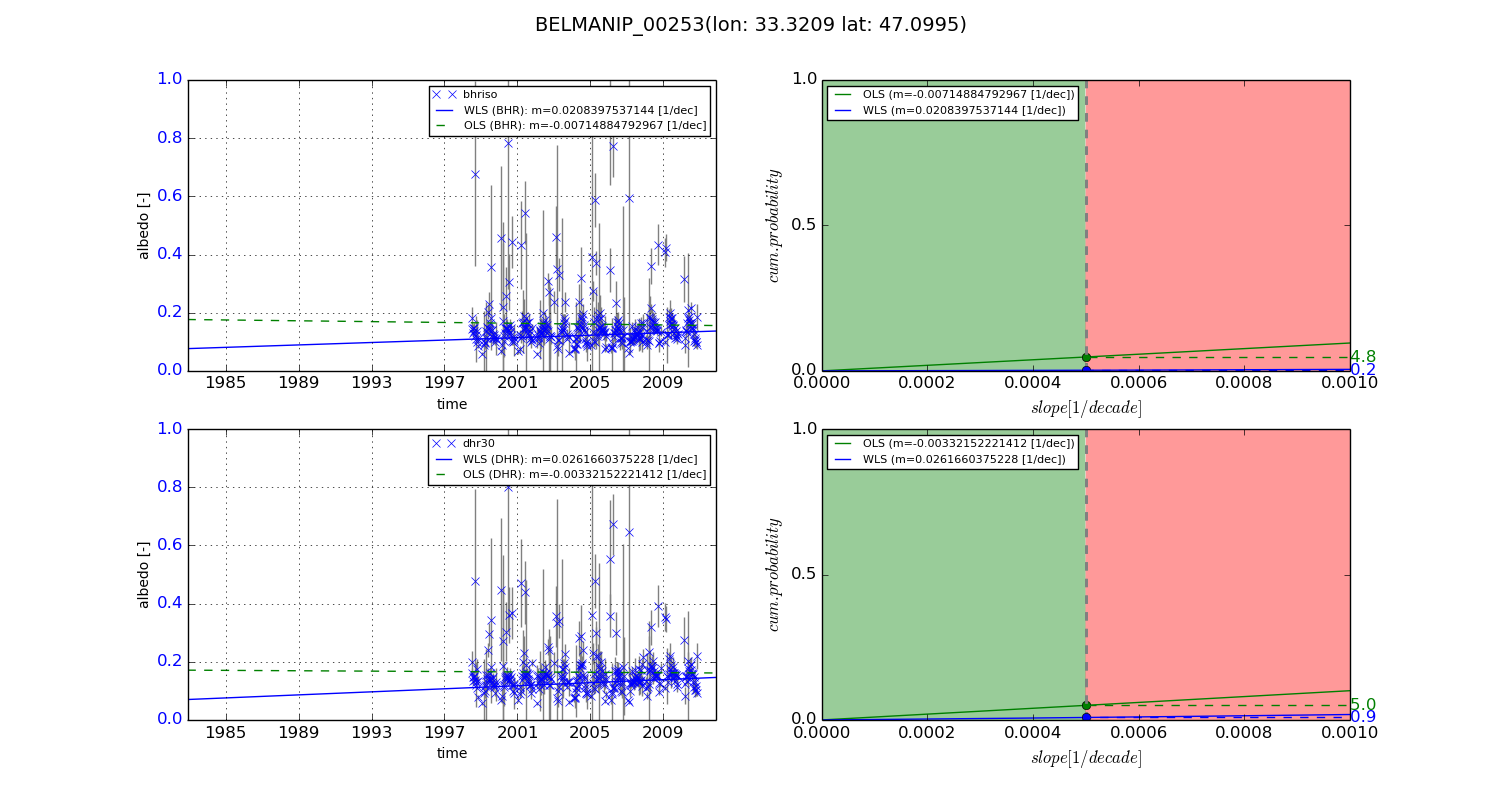
Temporal stability analysis

+000 deg (BHR)


BHR statistics

Temporal stability [1/decade]:


abs

rel


Weighted least square:

-0.0169033557526


Ordinary least square:

-0.0058815000972


Probabilities that GCOS criteria is met:

Weighted least square:

2.9 %

Ordinary least square:

4.6 %


DHR statistics

Temporal stability [1/decade]:


abs

rel


Weighted least square:

-0.0171023573879


Ordinary least square:

-0.00178752373773


Probabilities that GCOS criteria is met:

Weighted least square:

2.9 %

Ordinary least square:

5.5 %


+057/+063 deg (BHR)


BHR statistics

Temporal stability [1/decade]:


abs

rel


Weighted least square:

0.0208397537144


Ordinary least square:

-0.00714884792967


Probabilities that GCOS criteria is met:

Weighted least square:

0.2 %

Ordinary least square:

4.8 %


DHR statistics

Temporal stability [1/decade]:


abs

rel


Weighted least square:

0.0261660375228


Ordinary least square:

-0.00332152221412


Probabilities that GCOS criteria is met:

Weighted least square:

0.9 %

Ordinary least square:

5.0 %


Temporal anomaly analyis

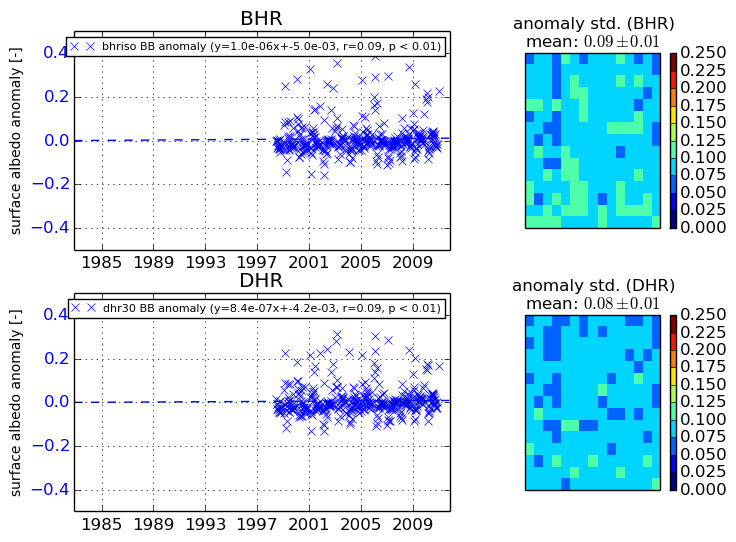
The variance of the temporal anomalies provides an additional measure about the stability of the signal AFTER removal of the mean seasonal cylce.
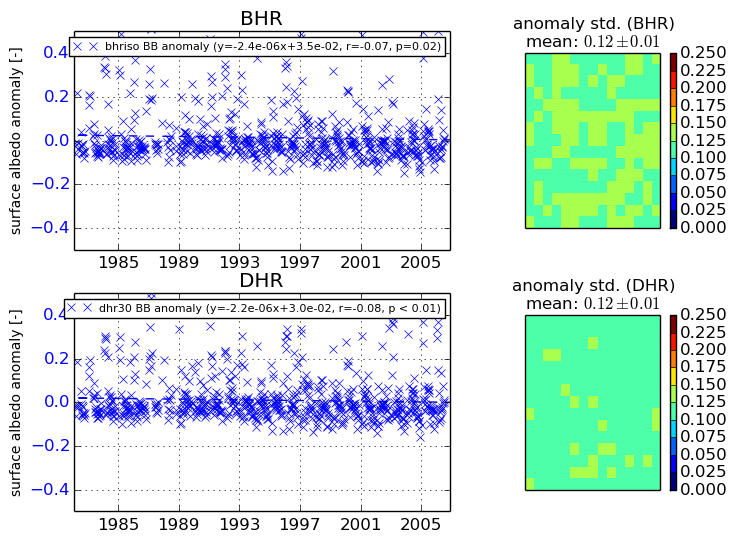
+000 deg


+057/+063 deg