BELMANIP_00280


Location

lon / lat [deg]: 116.8688 / -31.3838

Source network: BELMANIP


Geostationary surface albedo (GSA) data


“+000”


“+057/+063”


Landcover information (based on ESA CCI landcover data)


Landcover fractions @ 2km distance


Landcover fractions @ 20 km distance


Legend


Distance to open water bodies [km]:

7.14

Distance to urban areas [km]:

30.15


Radius: 1 km

Number of landcover classes:

4

Dominant landcover type:

10: cropland, rainfed

Fraction of dominant landcover type [%]:

78.0


Radius: 2 km

Number of landcover classes:

6

Dominant landcover type:

10: cropland, rainfed

Fraction of dominant landcover type [%]:

60.0


Radius: 5 km

Number of landcover classes:

6

Dominant landcover type:

10: cropland, rainfed

Fraction of dominant landcover type [%]:

68.0


Radius: 10 km

Number of landcover classes:

6

Dominant landcover type:

10: cropland, rainfed

Fraction of dominant landcover type [%]:

68.0


Radius: 20 km

Number of landcover classes:

5

Dominant landcover type:

10: cropland, rainfed

Fraction of dominant landcover type [%]:

73.0


Disturbances


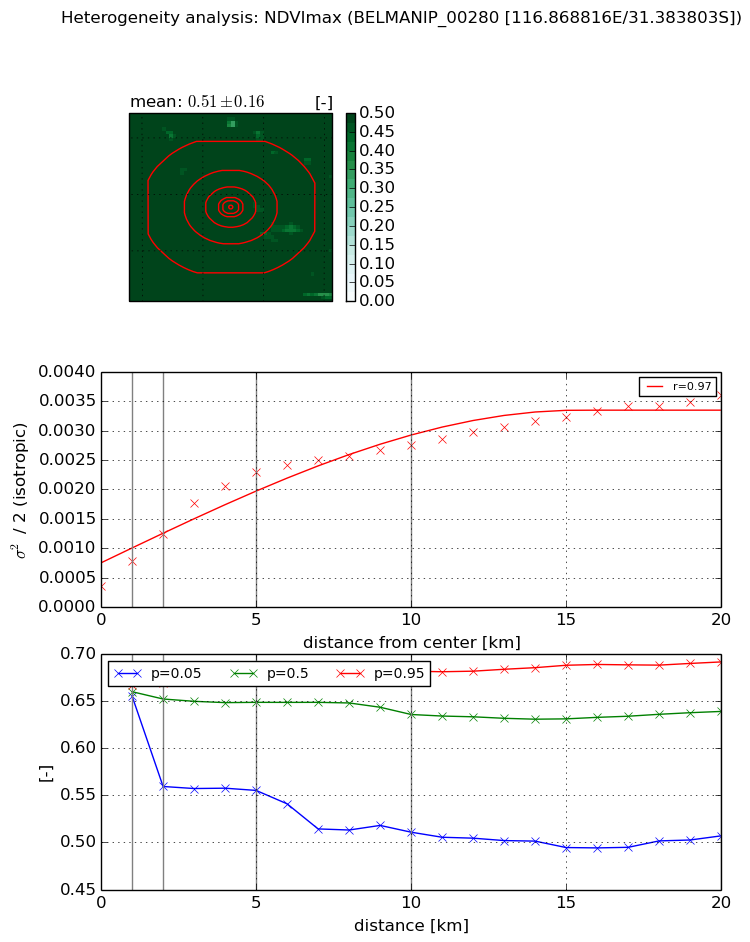
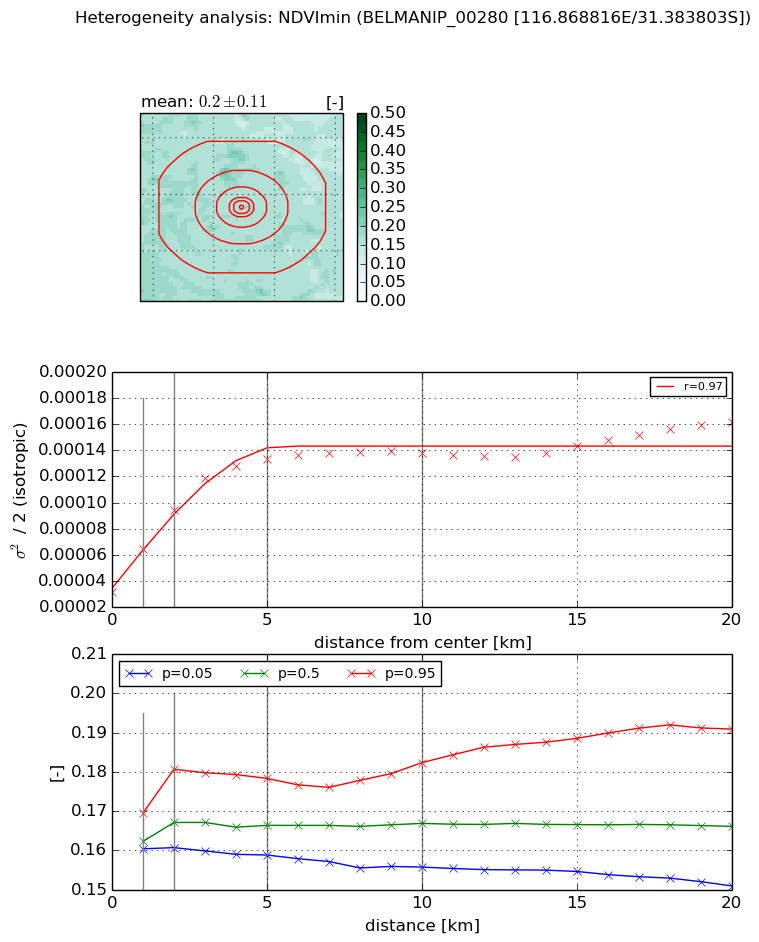
Heterogeneity analysis

The heterogeneity analysis provides information about the spatial and temporal heterogeneity of the site.

Topography


Roman et al. (2009) index


St

12.8571926738

Rcv

0.0493036117487

Rse

0.0

Rst

-0.0143746571475

Rsv

-0.169654160361


Height range @ 1km [m]

22

Height range @ 2km [m]

41

Height range @ 5km [m]

58

Height range @ 10km [m]

-999

Height range @ 20km [m]

-999


Variance slope @ 1 km

125

Variance slope @ 2 km

123

Variance slope @ 5 km

72

Variance slope @ 10 km

-999

Variance slope @ 20 km

-999


NDVI (max. NDVI composite)


Roman et al. (2009) index


St

14.4709086244

Rcv

0.0756384187234

Rse

0.0

Rst

0.0480720494122

Rsv

-0.0836020149888


NDVI range @ 1km [-]

0.01

NDVI range @ 2km [-]

0.11

NDVI range @ 5km [-]

0.13

NDVI range @ 10km [-]

0.17

NDVI range @ 20km [-]

0.18


Variance slope @ 1 km

0.000412116860772

Variance slope @ 2 km

0.000441871993347

Variance slope @ 5 km

0.000401522687617

Variance slope @ 10 km

0.000230189263478

Variance slope @ 20 km

0.00013471101127


NDVI (min. NDVI composite)I


Roman et al. (2009) index


St

nan

Rcv

nan

Rse

nan

Rst

nan

Rsv

nan


NDVI range @ 1km [-]

0.01

NDVI range @ 2km [-]

0.02

NDVI range @ 5km [-]

0.02

NDVI range @ 10km [-]

0.03

NDVI range @ 20km [-]

0.04


NDVI slope @ 1 km

3.30688471904e-05

NDVI slope @ 2 km

3.1379062485e-05

NDVI slope @ 5 km

2.06850996064e-05

NDVI slope @ 10 km

9.19532304534e-06

NDVI slope @ 20 km

3.94636946794e-06


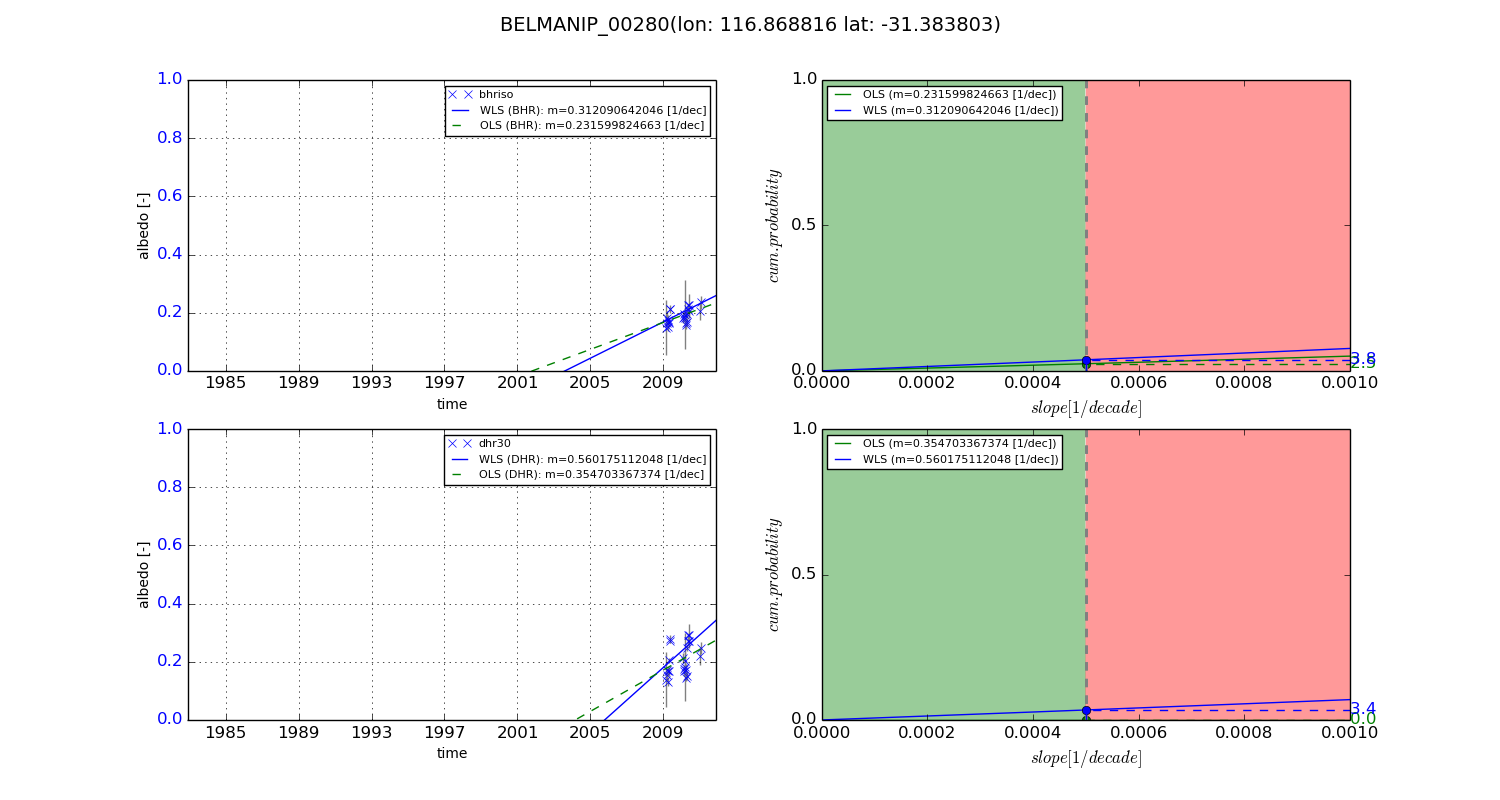
Temporal stability analysis

+000 deg (BHR)


BHR statistics

Temporal stability [1/decade]:


abs

rel


Weighted least square:

None


Ordinary least square:

None


Probabilities that GCOS criteria is met:

Weighted least square:

None %

Ordinary least square:

None %


DHR statistics

Temporal stability [1/decade]:


abs

rel


Weighted least square:

None


Ordinary least square:

None


Probabilities that GCOS criteria is met:

Weighted least square:

None %

Ordinary least square:

None %


+057/+063 deg (BHR)


BHR statistics

Temporal stability [1/decade]:


abs

rel


Weighted least square:

0.312090642046


Ordinary least square:

0.231599824663


Probabilities that GCOS criteria is met:

Weighted least square:

3.8 %

Ordinary least square:

2.5 %


DHR statistics

Temporal stability [1/decade]:


abs

rel


Weighted least square:

0.560175112048


Ordinary least square:

0.354703367374


Probabilities that GCOS criteria is met:

Weighted least square:

3.4 %

Ordinary least square:

0.0 %


Temporal anomaly analyis

The variance of the temporal anomalies provides an additional measure about the stability of the signal AFTER removal of the mean seasonal cylce.

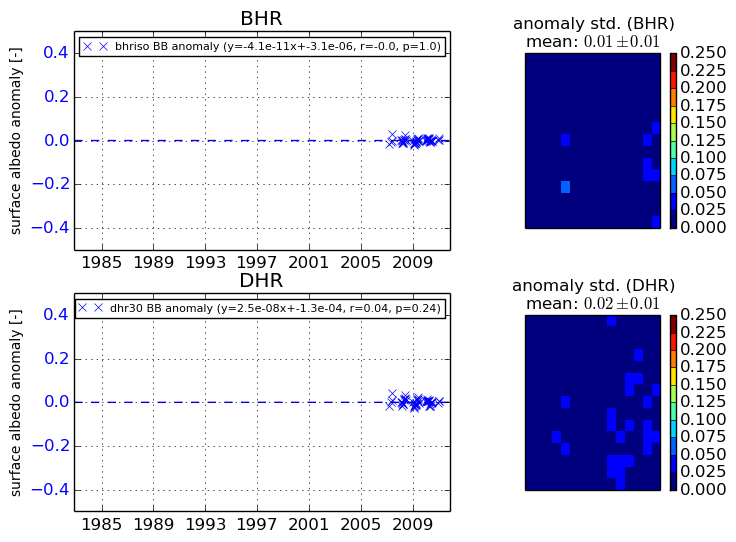
+000 deg


+057/+063 deg