BELMANIP_00285


Location

lon / lat [deg]: 124.98 / -23.6509

Source network: BELMANIP


Geostationary surface albedo (GSA) data


“+000”


“+057/+063”


Landcover information (based on ESA CCI landcover data)


Landcover fractions @ 2km distance


Landcover fractions @ 20 km distance


Legend


Distance to open water bodies [km]:

44.11

Distance to urban areas [km]:

none in region


Radius: 1 km

Number of landcover classes:

1

Dominant landcover type:

130: grassland

Fraction of dominant landcover type [%]:

100.0


Radius: 2 km

Number of landcover classes:

2

Dominant landcover type:

130: grassland

Fraction of dominant landcover type [%]:

99.0


Radius: 5 km

Number of landcover classes:

1

Dominant landcover type:

130: grassland

Fraction of dominant landcover type [%]:

100.0


Radius: 10 km

Number of landcover classes:

1

Dominant landcover type:

130: grassland

Fraction of dominant landcover type [%]:

100.0


Radius: 20 km

Number of landcover classes:

1

Dominant landcover type:

130: grassland

Fraction of dominant landcover type [%]:

100.0


Disturbances


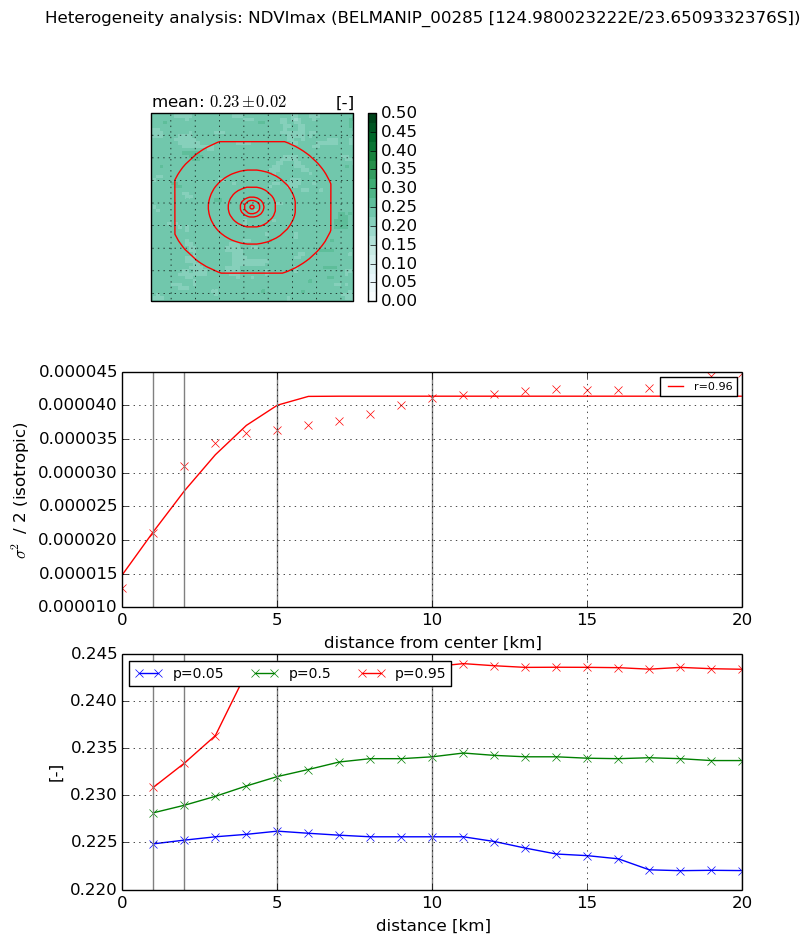
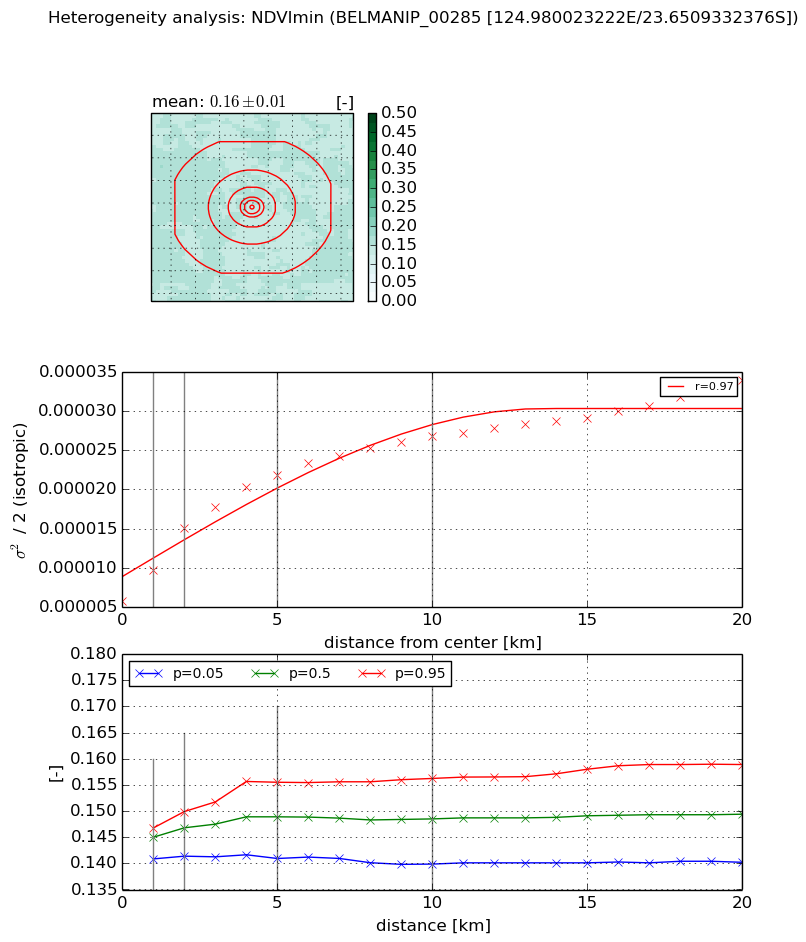
Heterogeneity analysis

The heterogeneity analysis provides information about the spatial and temporal heterogeneity of the site.

Topography


Roman et al. (2009) index


St

10.6167975547

Rcv

0.138214327728

Rse

0.0

Rst

-0.0375579283837

Rsv

0.106798828486


Height range @ 1km [m]

15

Height range @ 2km [m]

19

Height range @ 5km [m]

19

Height range @ 10km [m]

-999

Height range @ 20km [m]

-999


Variance slope @ 1 km

16

Variance slope @ 2 km

17

Variance slope @ 5 km

9

Variance slope @ 10 km

-999

Variance slope @ 20 km

-999


NDVI (max. NDVI composite)


Roman et al. (2009) index


St

6.26149952933

Rcv

0.194295121352

Rse

0.0

Rst

-0.188043865239

Rsv

-0.096779471526


NDVI range @ 1km [-]

0.01

NDVI range @ 2km [-]

0.01

NDVI range @ 5km [-]

0.02

NDVI range @ 10km [-]

0.02

NDVI range @ 20km [-]

0.02


Variance slope @ 1 km

8.22676462339e-06

Variance slope @ 2 km

9.11415319859e-06

Variance slope @ 5 km

4.73063641836e-06

Variance slope @ 10 km

2.25985768976e-06

Variance slope @ 20 km

1.0356949624e-06


NDVI (min. NDVI composite)I


Roman et al. (2009) index


St

0.341076885789

Rcv

0.211196044356

Rse

0.0

Rst

9.22693417912e-09

Rsv

8.58447473207


NDVI range @ 1km [-]

0.01

NDVI range @ 2km [-]

0.01

NDVI range @ 5km [-]

0.01

NDVI range @ 10km [-]

0.02

NDVI range @ 20km [-]

0.02


NDVI slope @ 1 km

3.86516902005e-06

NDVI slope @ 2 km

4.65255208575e-06

NDVI slope @ 5 km

3.26431325912e-06

NDVI slope @ 10 km

1.97491599277e-06

NDVI slope @ 20 km

1.10255094483e-06


Temporal stability analysis

+000 deg (BHR)


BHR statistics

Temporal stability [1/decade]:


abs

rel


Weighted least square:

None


Ordinary least square:

None


Probabilities that GCOS criteria is met:

Weighted least square:

None %

Ordinary least square:

None %


DHR statistics

Temporal stability [1/decade]:


abs

rel


Weighted least square:

None


Ordinary least square:

None


Probabilities that GCOS criteria is met:

Weighted least square:

None %

Ordinary least square:

None %


+057/+063 deg (BHR)


BHR statistics

Temporal stability [1/decade]:


abs

rel


Weighted least square:

-99999.0


Ordinary least square:

-99999.0


Probabilities that GCOS criteria is met:

Weighted least square:

-99999.0 %

Ordinary least square:

-99999.0 %


DHR statistics

Temporal stability [1/decade]:


abs

rel


Weighted least square:

-99999.0


Ordinary least square:

-99999.0


Probabilities that GCOS criteria is met:

Weighted least square:

-99999.0 %

Ordinary least square:

-99999.0 %


Temporal anomaly analyis

The variance of the temporal anomalies provides an additional measure about the stability of the signal AFTER removal of the mean seasonal cylce.

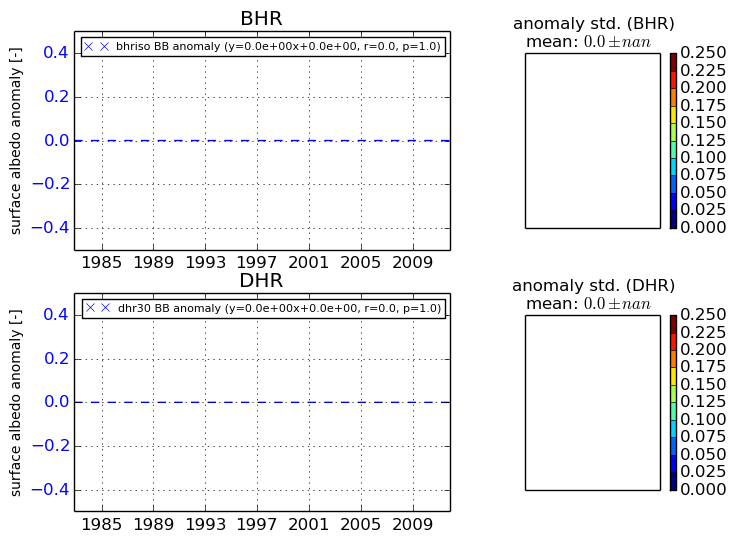
+000 deg


+057/+063 deg