BELMANIP_00309


Location

lon / lat [deg]: 116.3055 / 1.7932

Source network: BELMANIP


Geostationary surface albedo (GSA) data


“+000”


“+057/+063”


Landcover information (based on ESA CCI landcover data)


Landcover fractions @ 2km distance


Landcover fractions @ 20 km distance


Legend


Distance to open water bodies [km]:

27.37

Distance to urban areas [km]:

none in region


Radius: 1 km

Number of landcover classes:

1

Dominant landcover type:

50: Tree cover, broadleaved, evergreen, closed to open (>15%)

Fraction of dominant landcover type [%]:

100.0


Radius: 2 km

Number of landcover classes:

1

Dominant landcover type:

50: Tree cover, broadleaved, evergreen, closed to open (>15%)

Fraction of dominant landcover type [%]:

100.0


Radius: 5 km

Number of landcover classes:

1

Dominant landcover type:

50: Tree cover, broadleaved, evergreen, closed to open (>15%)

Fraction of dominant landcover type [%]:

100.0


Radius: 10 km

Number of landcover classes:

1

Dominant landcover type:

50: Tree cover, broadleaved, evergreen, closed to open (>15%)

Fraction of dominant landcover type [%]:

100.0


Radius: 20 km

Number of landcover classes:

1

Dominant landcover type:

50: Tree cover, broadleaved, evergreen, closed to open (>15%)

Fraction of dominant landcover type [%]:

100.0


Disturbances


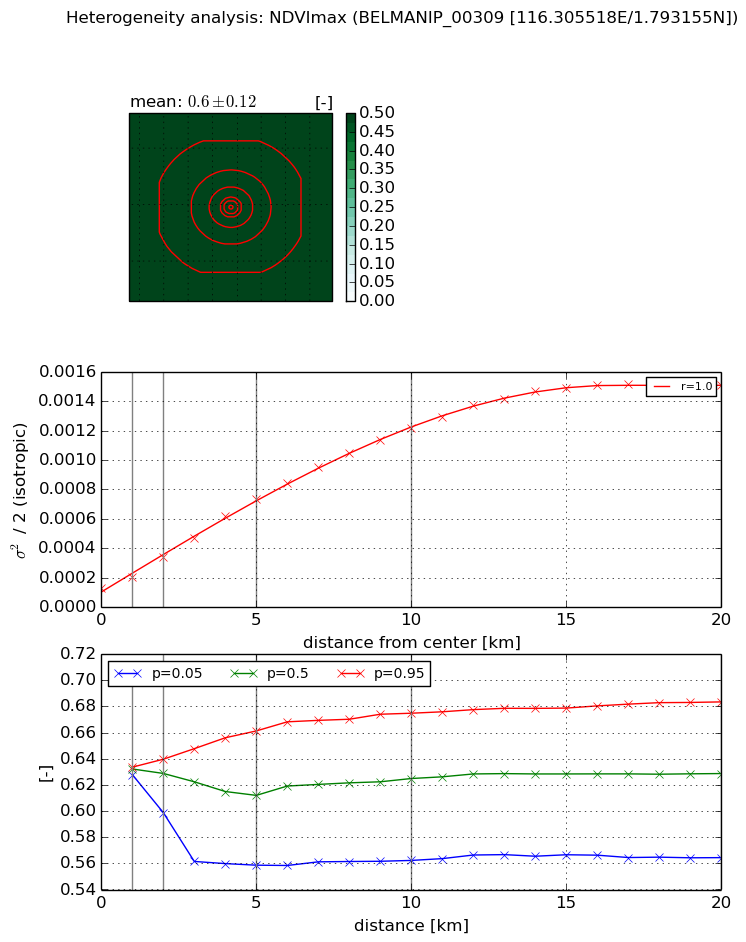
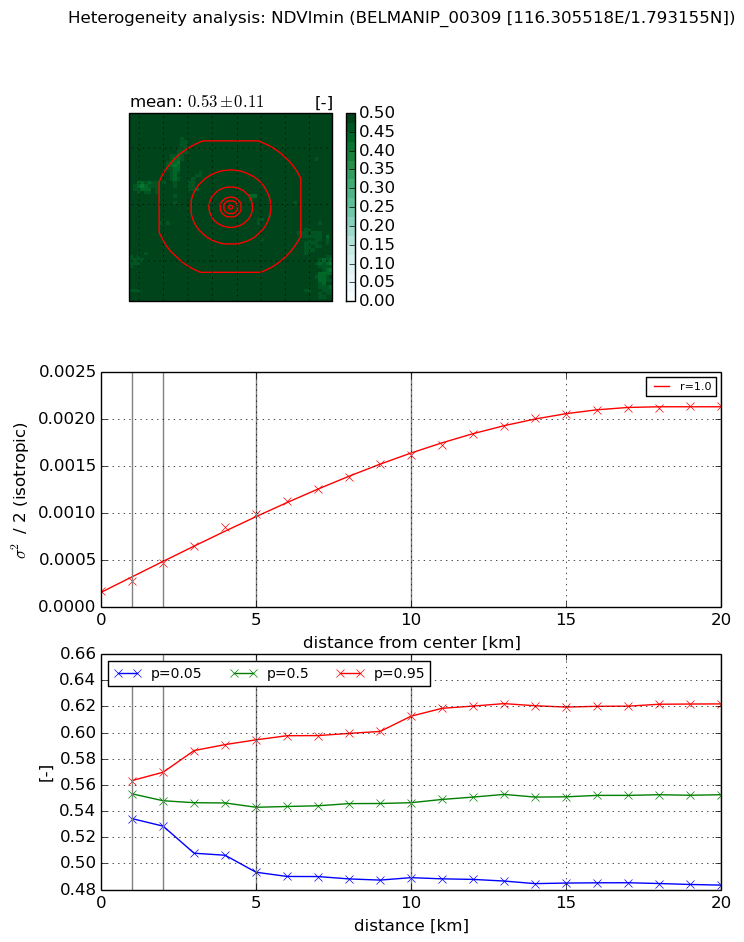
Heterogeneity analysis

The heterogeneity analysis provides information about the spatial and temporal heterogeneity of the site.

Topography


Roman et al. (2009) index


St

6.74845399962e-06

Rcv

0.309803553382

Rse

0.0

Rst

-0.0157356106897

Rsv

444545.936489


Height range @ 1km [m]

233

Height range @ 2km [m]

350

Height range @ 5km [m]

660

Height range @ 10km [m]

-999

Height range @ 20km [m]

-999


Variance slope @ 1 km

12469

Variance slope @ 2 km

10926

Variance slope @ 5 km

7870

Variance slope @ 10 km

-999

Variance slope @ 20 km

-999


NDVI (max. NDVI composite)


Roman et al. (2009) index


St

2.67186016495e-14

Rcv

0.146861729374

Rse

0.0

Rst

0.341885541097

Rsv

1.12281325174e+14


NDVI range @ 1km [-]

0.01

NDVI range @ 2km [-]

0.04

NDVI range @ 5km [-]

0.1

NDVI range @ 10km [-]

0.11

NDVI range @ 20km [-]

0.12


Variance slope @ 1 km

7.86013868834e-05

Variance slope @ 2 km

0.000107862805231

Variance slope @ 5 km

0.00012597227368

Variance slope @ 10 km

0.000113350224993

Variance slope @ 20 km

7.26343422707e-05


NDVI (min. NDVI composite)I


Roman et al. (2009) index


St

2.34872150584

Rcv

0.337672098121

Rse

0.0

Rst

-7.64271613019e-07

Rsv

-0.939617779578


NDVI range @ 1km [-]

0.03

NDVI range @ 2km [-]

0.04

NDVI range @ 5km [-]

0.1

NDVI range @ 10km [-]

0.12

NDVI range @ 20km [-]

0.14


NDVI slope @ 1 km

0.000111250544479

NDVI slope @ 2 km

0.000152007788191

NDVI slope @ 5 km

0.000171442767506

NDVI slope @ 10 km

0.000149846598722

NDVI slope @ 20 km

0.000103083731577


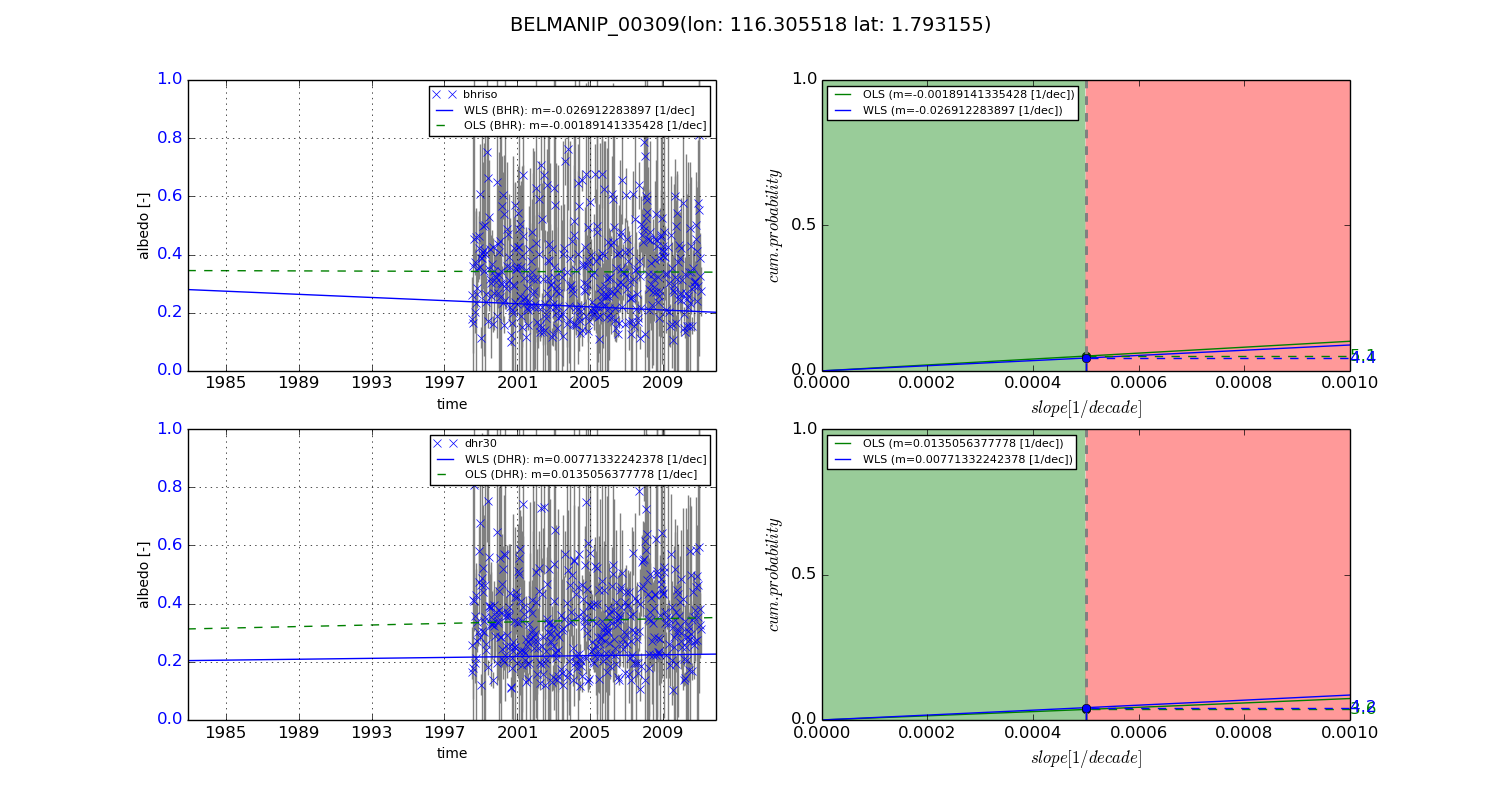
Temporal stability analysis

+000 deg (BHR)


BHR statistics

Temporal stability [1/decade]:


abs

rel


Weighted least square:

None


Ordinary least square:

None


Probabilities that GCOS criteria is met:

Weighted least square:

None %

Ordinary least square:

None %


DHR statistics

Temporal stability [1/decade]:


abs

rel


Weighted least square:

None


Ordinary least square:

None


Probabilities that GCOS criteria is met:

Weighted least square:

None %

Ordinary least square:

None %


+057/+063 deg (BHR)


BHR statistics

Temporal stability [1/decade]:


abs

rel


Weighted least square:

-0.026912283897


Ordinary least square:

-0.00189141335428


Probabilities that GCOS criteria is met:

Weighted least square:

4.4 %

Ordinary least square:

5.1 %


DHR statistics

Temporal stability [1/decade]:


abs

rel


Weighted least square:

0.00771332242378


Ordinary least square:

0.0135056377778


Probabilities that GCOS criteria is met:

Weighted least square:

4.2 %

Ordinary least square:

3.6 %


Temporal anomaly analyis

The variance of the temporal anomalies provides an additional measure about the stability of the signal AFTER removal of the mean seasonal cylce.

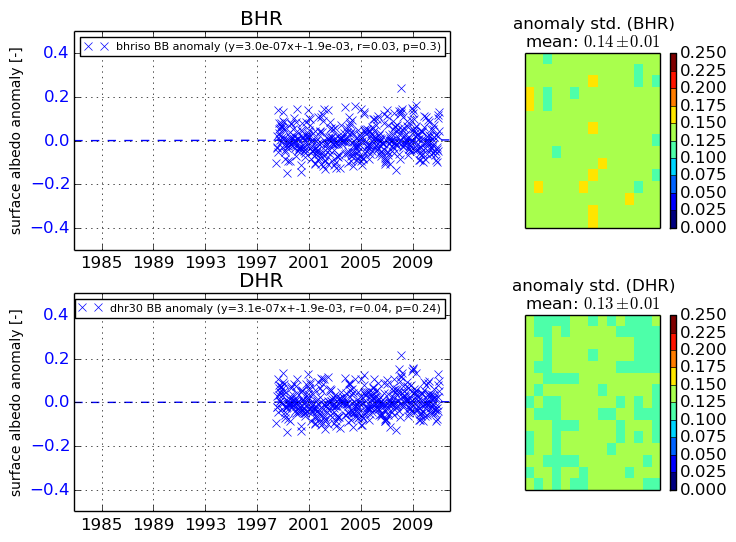
+000 deg


+057/+063 deg