BELMANIP_00320


Location

lon / lat [deg]: 121.2499 / 24.5384

Source network: BELMANIP


Geostationary surface albedo (GSA) data


“+000”


“+057/+063”


Landcover information (based on ESA CCI landcover data)


Landcover fractions @ 2km distance


Landcover fractions @ 20 km distance


Legend


Distance to open water bodies [km]:

2.09

Distance to urban areas [km]:

23.74


Radius: 1 km

Number of landcover classes:

1

Dominant landcover type:

50: Tree cover, broadleaved, evergreen, closed to open (>15%)

Fraction of dominant landcover type [%]:

100.0


Radius: 2 km

Number of landcover classes:

1

Dominant landcover type:

50: Tree cover, broadleaved, evergreen, closed to open (>15%)

Fraction of dominant landcover type [%]:

100.0


Radius: 5 km

Number of landcover classes:

1

Dominant landcover type:

50: Tree cover, broadleaved, evergreen, closed to open (>15%)

Fraction of dominant landcover type [%]:

100.0


Radius: 10 km

Number of landcover classes:

1

Dominant landcover type:

50: Tree cover, broadleaved, evergreen, closed to open (>15%)

Fraction of dominant landcover type [%]:

100.0


Radius: 20 km

Number of landcover classes:

1

Dominant landcover type:

50: Tree cover, broadleaved, evergreen, closed to open (>15%)

Fraction of dominant landcover type [%]:

99.0


Disturbances


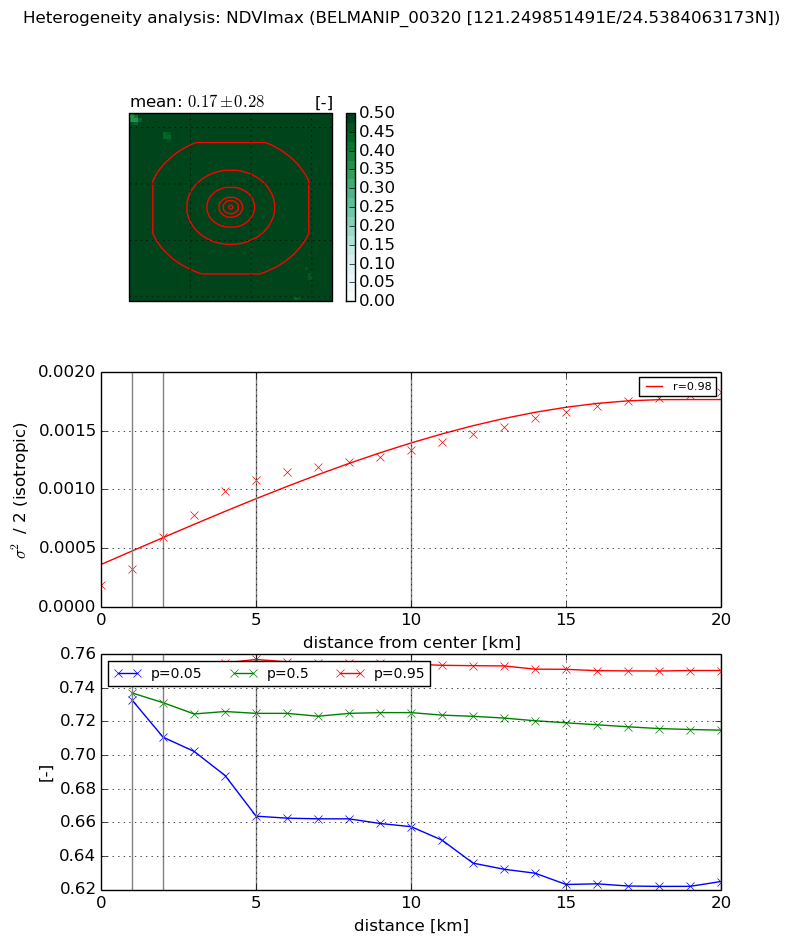
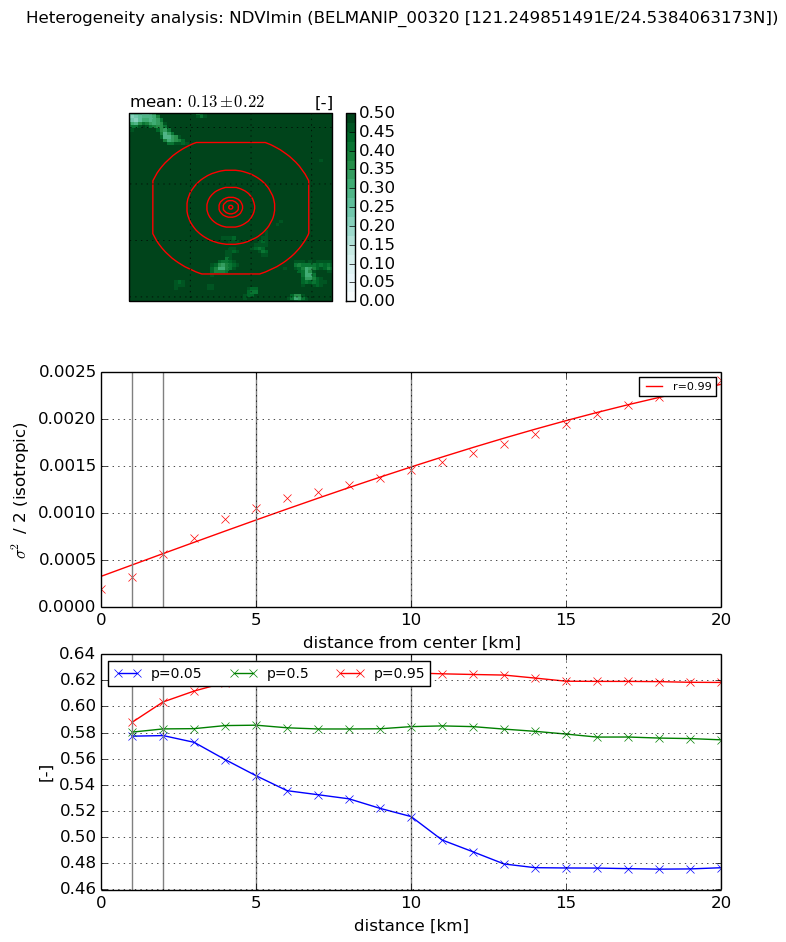
Heterogeneity analysis

The heterogeneity analysis provides information about the spatial and temporal heterogeneity of the site.

Topography


Roman et al. (2009) index


St

0.000572497404837

Rcv

0.36176360634

Rse

0.0

Rst

0.0267056716722

Rsv

5239.80995721


Height range @ 1km [m]

678

Height range @ 2km [m]

714

Height range @ 5km [m]

1226

Height range @ 10km [m]

-999

Height range @ 20km [m]

-999


Variance slope @ 1 km

30756

Variance slope @ 2 km

33598

Variance slope @ 5 km

28964

Variance slope @ 10 km

-999

Variance slope @ 20 km

-999


NDVI (max. NDVI composite)


Roman et al. (2009) index


St

1.55883462008

Rcv

0.959255062613

Rse

0.0

Rst

-2.83942443923e-07

Rsv

-0.965259262852


NDVI range @ 1km [-]

0.02

NDVI range @ 2km [-]

0.03

NDVI range @ 5km [-]

0.09

NDVI range @ 10km [-]

0.1

NDVI range @ 20km [-]

0.13


Variance slope @ 1 km

0.000138306465128

Variance slope @ 2 km

0.000202297832768

Variance slope @ 5 km

0.000189445667073

Variance slope @ 10 km

0.000113347195773

Variance slope @ 20 km

7.35167212063e-05


NDVI (min. NDVI composite)I


Roman et al. (2009) index


St

nan

Rcv

nan

Rse

nan

Rst

nan

Rsv

nan


NDVI range @ 1km [-]

0.01

NDVI range @ 2km [-]

0.03

NDVI range @ 5km [-]

0.08

NDVI range @ 10km [-]

0.11

NDVI range @ 20km [-]

0.14


NDVI slope @ 1 km

0.00012613376108

NDVI slope @ 2 km

0.000184633179914

NDVI slope @ 5 km

0.000180525015997

NDVI slope @ 10 km

0.000126609574562

NDVI slope @ 20 km

0.000103620179847


Temporal stability analysis

+000 deg (BHR)


BHR statistics

Temporal stability [1/decade]:


abs

rel


Weighted least square:

None


Ordinary least square:

None


Probabilities that GCOS criteria is met:

Weighted least square:

None %

Ordinary least square:

None %


DHR statistics

Temporal stability [1/decade]:


abs

rel


Weighted least square:

None


Ordinary least square:

None


Probabilities that GCOS criteria is met:

Weighted least square:

None %

Ordinary least square:

None %


+057/+063 deg (BHR)


BHR statistics

Temporal stability [1/decade]:


abs

rel


Weighted least square:

-99999.0


Ordinary least square:

-99999.0


Probabilities that GCOS criteria is met:

Weighted least square:

-99999.0 %

Ordinary least square:

-99999.0 %


DHR statistics

Temporal stability [1/decade]:


abs

rel


Weighted least square:

-99999.0


Ordinary least square:

-99999.0


Probabilities that GCOS criteria is met:

Weighted least square:

-99999.0 %

Ordinary least square:

-99999.0 %


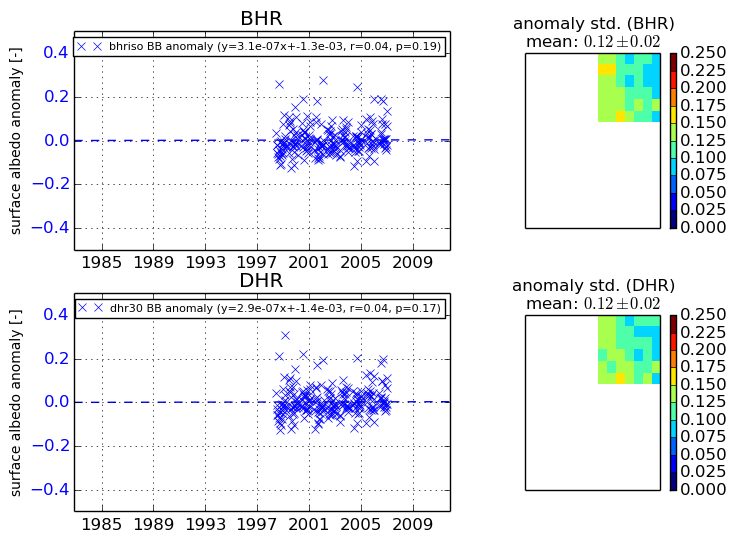
Temporal anomaly analyis

The variance of the temporal anomalies provides an additional measure about the stability of the signal AFTER removal of the mean seasonal cylce.

+000 deg


+057/+063 deg