BELMANIP_00330


Location

lon / lat [deg]: 91.0521 / 29.1726

Source network: BELMANIP


Geostationary surface albedo (GSA) data


“+000”


“+057/+063”


Landcover information (based on ESA CCI landcover data)


Landcover fractions @ 2km distance


Landcover fractions @ 20 km distance


Legend


Distance to open water bodies [km]:

13.6

Distance to urban areas [km]:

13.5


Radius: 1 km

Number of landcover classes:

2

Dominant landcover type:

130: grassland

Fraction of dominant landcover type [%]:

89.0


Radius: 2 km

Number of landcover classes:

3

Dominant landcover type:

130: grassland

Fraction of dominant landcover type [%]:

91.0


Radius: 5 km

Number of landcover classes:

4

Dominant landcover type:

130: grassland

Fraction of dominant landcover type [%]:

94.0


Radius: 10 km

Number of landcover classes:

4

Dominant landcover type:

130: grassland

Fraction of dominant landcover type [%]:

91.0


Radius: 20 km

Number of landcover classes:

6

Dominant landcover type:

130: grassland

Fraction of dominant landcover type [%]:

85.0


Disturbances


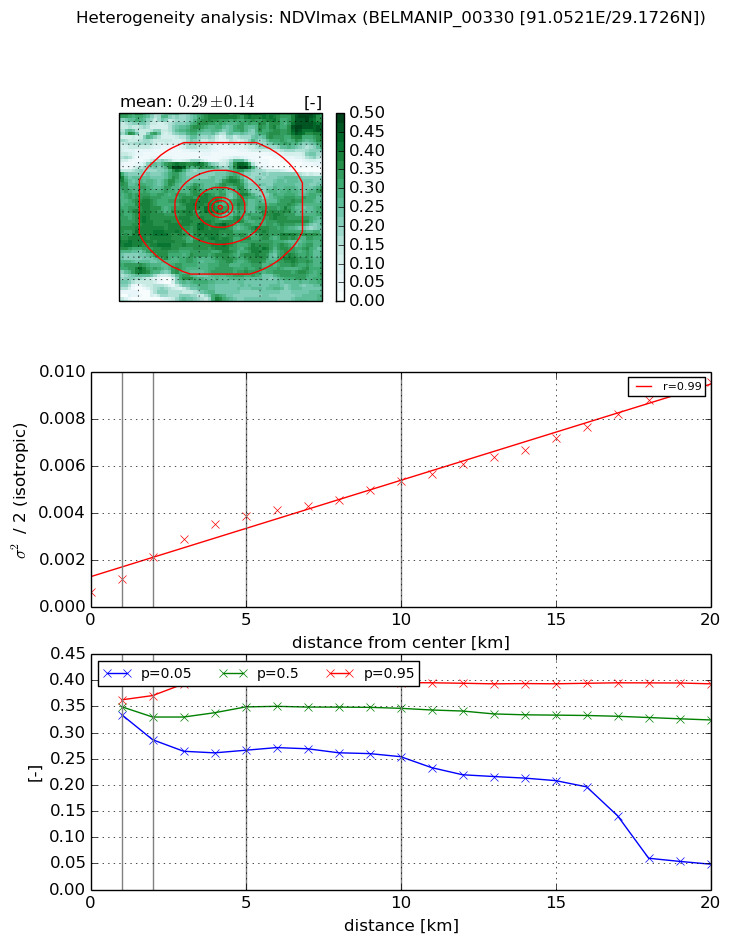
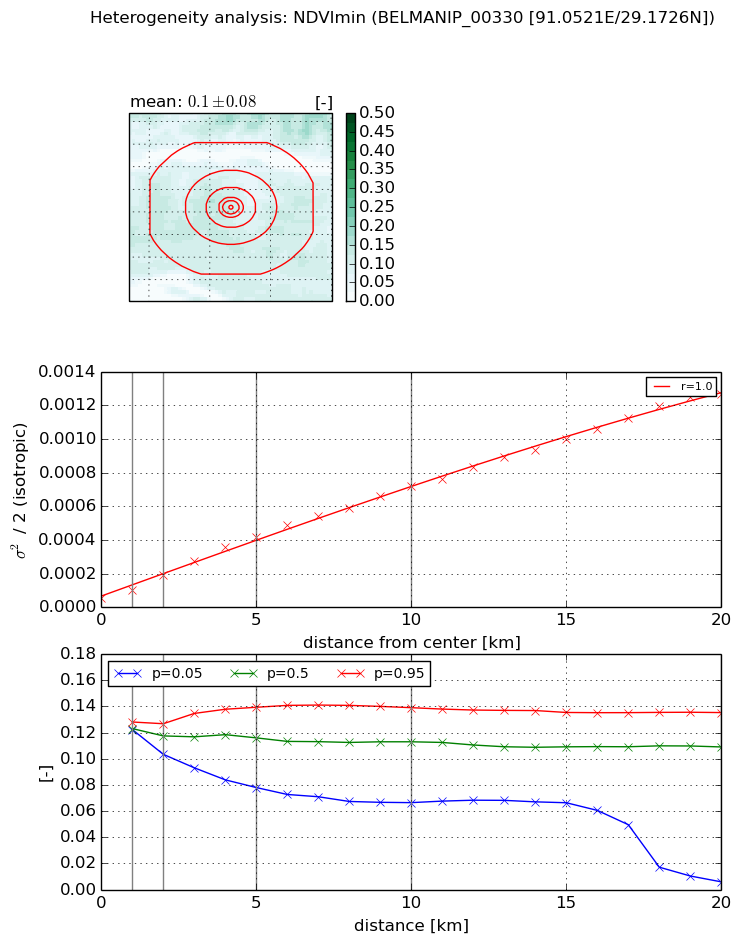
Heterogeneity analysis

The heterogeneity analysis provides information about the spatial and temporal heterogeneity of the site.

Topography


Roman et al. (2009) index


St

2.3345946473

Rcv

0.418943431662

Rse

0.0

Rst

-5.06485261473e-08

Rsv

-0.866076169162


Height range @ 1km [m]

448

Height range @ 2km [m]

664

Height range @ 5km [m]

1138

Height range @ 10km [m]

-999

Height range @ 20km [m]

-999


Variance slope @ 1 km

19598

Variance slope @ 2 km

23477

Variance slope @ 5 km

25258

Variance slope @ 10 km

-999

Variance slope @ 20 km

-999


NDVI (max. NDVI composite)


Roman et al. (2009) index


St

2.90676926515e-06

Rcv

-0.0594395500336

Rse

0.0

Rst

0.137866619643

Rsv

1032073.46467


NDVI range @ 1km [-]

0.03

NDVI range @ 2km [-]

0.08

NDVI range @ 5km [-]

0.14

NDVI range @ 10km [-]

0.14

NDVI range @ 20km [-]

0.34


Variance slope @ 1 km

0.000544967013557

Variance slope @ 2 km

0.000736120521837

Variance slope @ 5 km

0.000683612838881

Variance slope @ 10 km

0.000451090490309

Variance slope @ 20 km

0.000409232633655


NDVI (min. NDVI composite)I


Roman et al. (2009) index


St

1.77263916985

Rcv

0.478726804914

Rse

0.0

Rst

-2.67438710318e-09

Rsv

1.213664995


NDVI range @ 1km [-]

0.01

NDVI range @ 2km [-]

0.02

NDVI range @ 5km [-]

0.06

NDVI range @ 10km [-]

0.07

NDVI range @ 20km [-]

0.13


NDVI slope @ 1 km

4.82674083372e-05

NDVI slope @ 2 km

6.73550524462e-05

NDVI slope @ 5 km

7.65178390598e-05

NDVI slope @ 10 km

6.77158344606e-05

NDVI slope @ 20 km

6.10540481134e-05


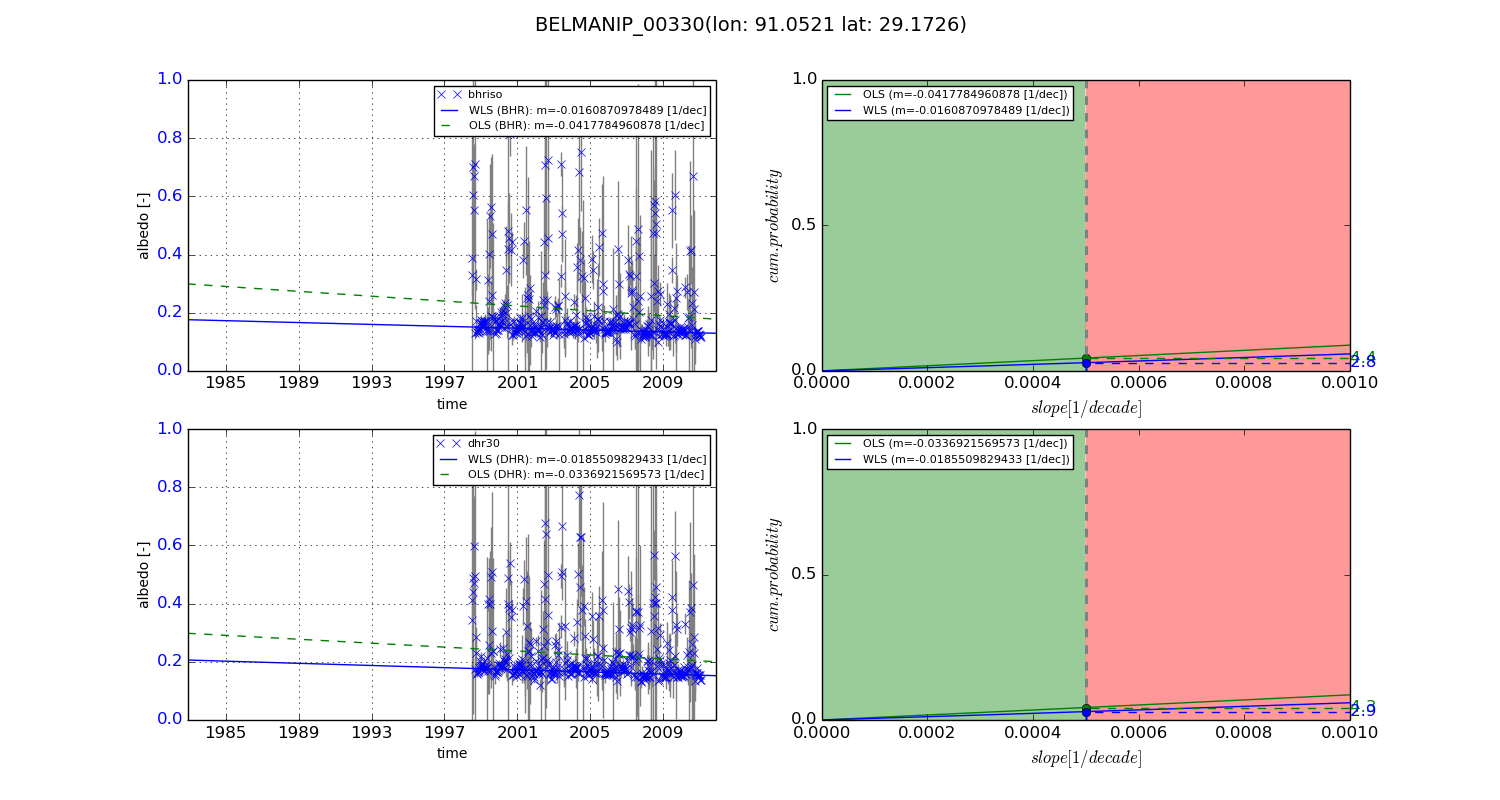
Temporal stability analysis

+000 deg (BHR)


BHR statistics

Temporal stability [1/decade]:


abs

rel


Weighted least square:

None


Ordinary least square:

None


Probabilities that GCOS criteria is met:

Weighted least square:

None %

Ordinary least square:

None %


DHR statistics

Temporal stability [1/decade]:


abs

rel


Weighted least square:

None


Ordinary least square:

None


Probabilities that GCOS criteria is met:

Weighted least square:

None %

Ordinary least square:

None %


+057/+063 deg (BHR)


BHR statistics

Temporal stability [1/decade]:


abs

rel


Weighted least square:

-0.0160870978489


Ordinary least square:

-0.0417784960878


Probabilities that GCOS criteria is met:

Weighted least square:

2.8 %

Ordinary least square:

4.4 %


DHR statistics

Temporal stability [1/decade]:


abs

rel


Weighted least square:

-0.0185509829433


Ordinary least square:

-0.0336921569573


Probabilities that GCOS criteria is met:

Weighted least square:

2.9 %

Ordinary least square:

4.3 %


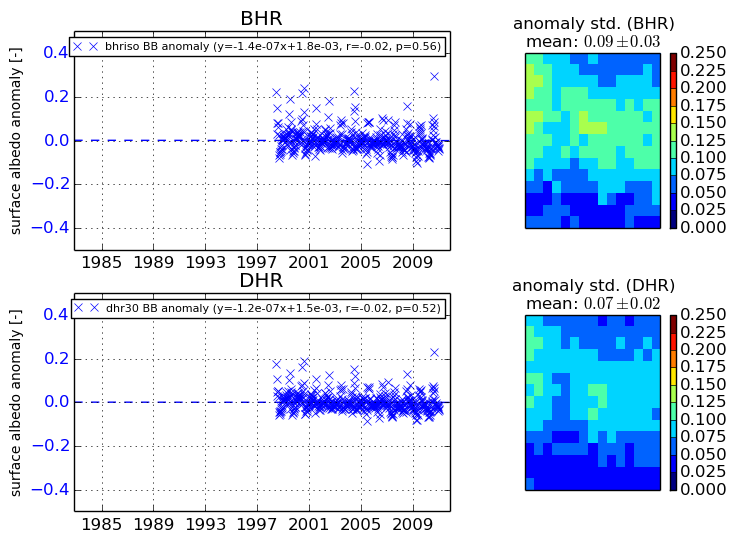
Temporal anomaly analyis

The variance of the temporal anomalies provides an additional measure about the stability of the signal AFTER removal of the mean seasonal cylce.

+000 deg


+057/+063 deg