BELMANIP_00344


Location

lon / lat [deg]: 64.0875 / 36.3323

Source network: BELMANIP


Geostationary surface albedo (GSA) data


“+000”


“+057/+063”


Landcover information (based on ESA CCI landcover data)


Landcover fractions @ 2km distance


Landcover fractions @ 20 km distance


Legend


Distance to open water bodies [km]:

none in region

Distance to urban areas [km]:

61.65


Radius: 1 km

Number of landcover classes:

1

Dominant landcover type:

20: cropland, irrigated or post-flooded

Fraction of dominant landcover type [%]:

100.0


Radius: 2 km

Number of landcover classes:

3

Dominant landcover type:

20: cropland, irrigated or post-flooded

Fraction of dominant landcover type [%]:

70.0


Radius: 5 km

Number of landcover classes:

3

Dominant landcover type:

30: mosaic cropland (>50%), natural veg. (< 50%)

Fraction of dominant landcover type [%]:

35.0


Radius: 10 km

Number of landcover classes:

3

Dominant landcover type:

30: mosaic cropland (>50%), natural veg. (< 50%)

Fraction of dominant landcover type [%]:

48.0


Radius: 20 km

Number of landcover classes:

3

Dominant landcover type:

30: mosaic cropland (>50%), natural veg. (< 50%)

Fraction of dominant landcover type [%]:

50.0


Disturbances


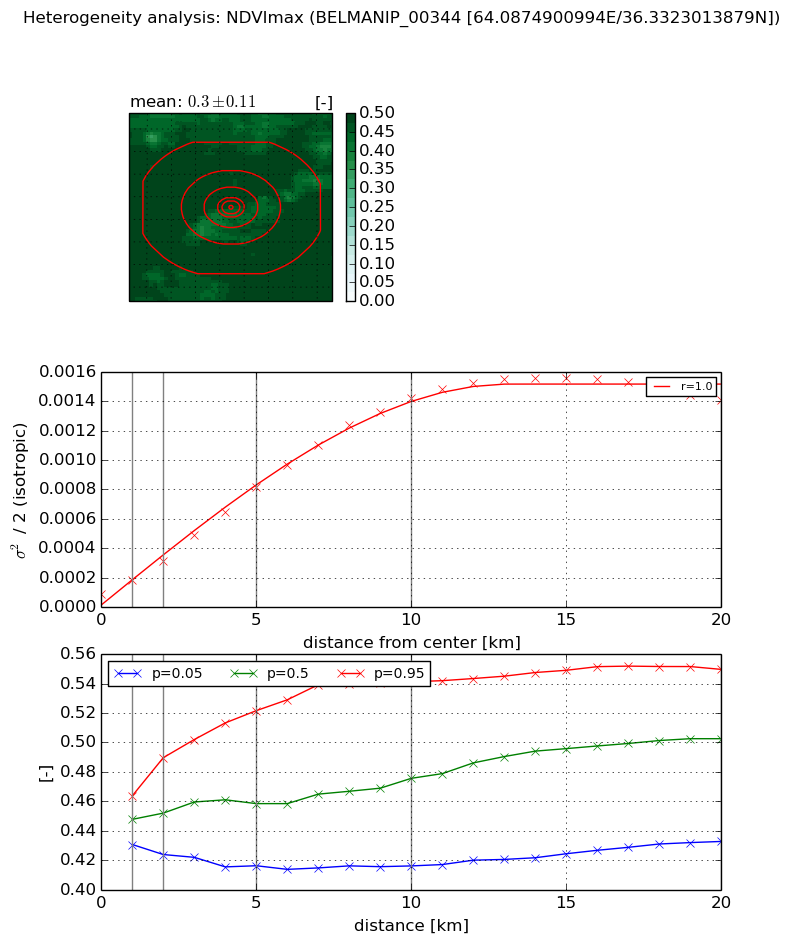
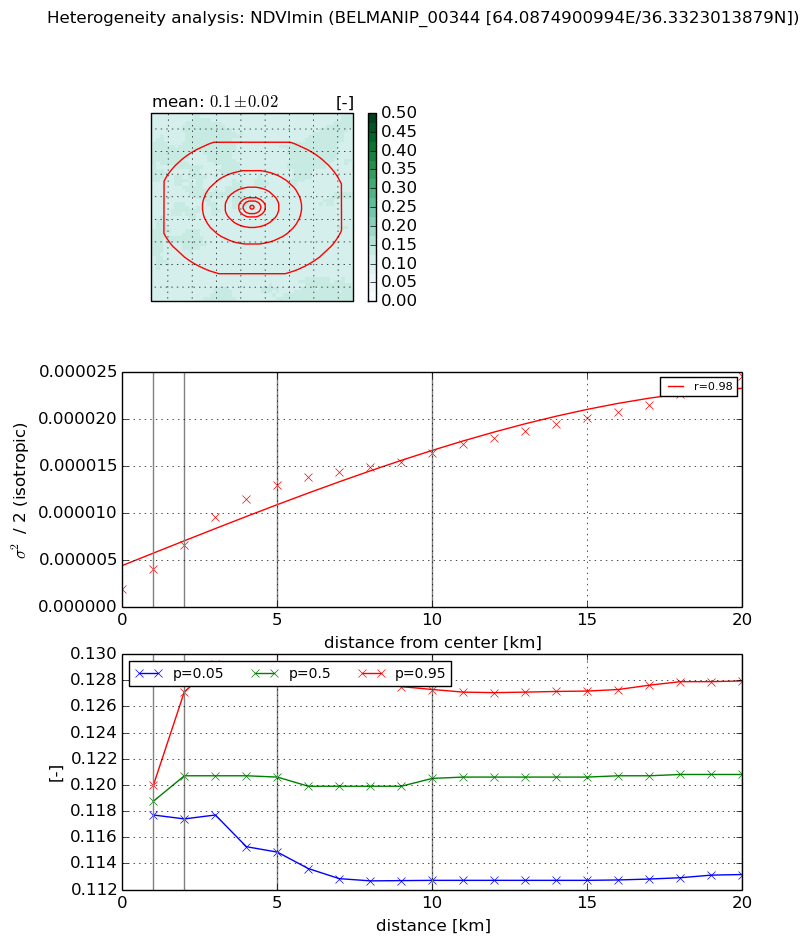
Heterogeneity analysis

The heterogeneity analysis provides information about the spatial and temporal heterogeneity of the site.

Topography


Roman et al. (2009) index


St

2.58160674711

Rcv

0.0318542904064

Rse

0.0

Rst

-0.130212784128

Rsv

-0.999999922447


Height range @ 1km [m]

112

Height range @ 2km [m]

130

Height range @ 5km [m]

160

Height range @ 10km [m]

-999

Height range @ 20km [m]

-999


Variance slope @ 1 km

680

Variance slope @ 2 km

611

Variance slope @ 5 km

539

Variance slope @ 10 km

-999

Variance slope @ 20 km

-999


NDVI (max. NDVI composite)


Roman et al. (2009) index


St

7.4431192556

Rcv

0.161300302498

Rse

0.0

Rst

-0.125651462247

Rsv

0.116105058204


NDVI range @ 1km [-]

0.03

NDVI range @ 2km [-]

0.07

NDVI range @ 5km [-]

0.11

NDVI range @ 10km [-]

0.13

NDVI range @ 20km [-]

0.12


Variance slope @ 1 km

9.96949802042e-05

Variance slope @ 2 km

0.000112508928554

Variance slope @ 5 km

0.000149170313171

Variance slope @ 10 km

0.00014153369204

Variance slope @ 20 km

7.11750478733e-05


NDVI (min. NDVI composite)I


Roman et al. (2009) index


St

1.57524010355e-08

Rcv

0.127268040293

Rse

0.0

Rst

0.0980252760677

Rsv

190447157.21


NDVI range @ 1km [-]

0.0

NDVI range @ 2km [-]

0.01

NDVI range @ 5km [-]

0.01

NDVI range @ 10km [-]

0.01

NDVI range @ 20km [-]

0.01


NDVI slope @ 1 km

2.17791641278e-06

NDVI slope @ 2 km

2.35709298791e-06

NDVI slope @ 5 km

2.30829277305e-06

NDVI slope @ 10 km

1.4041289449e-06

NDVI slope @ 20 km

9.73838384254e-07


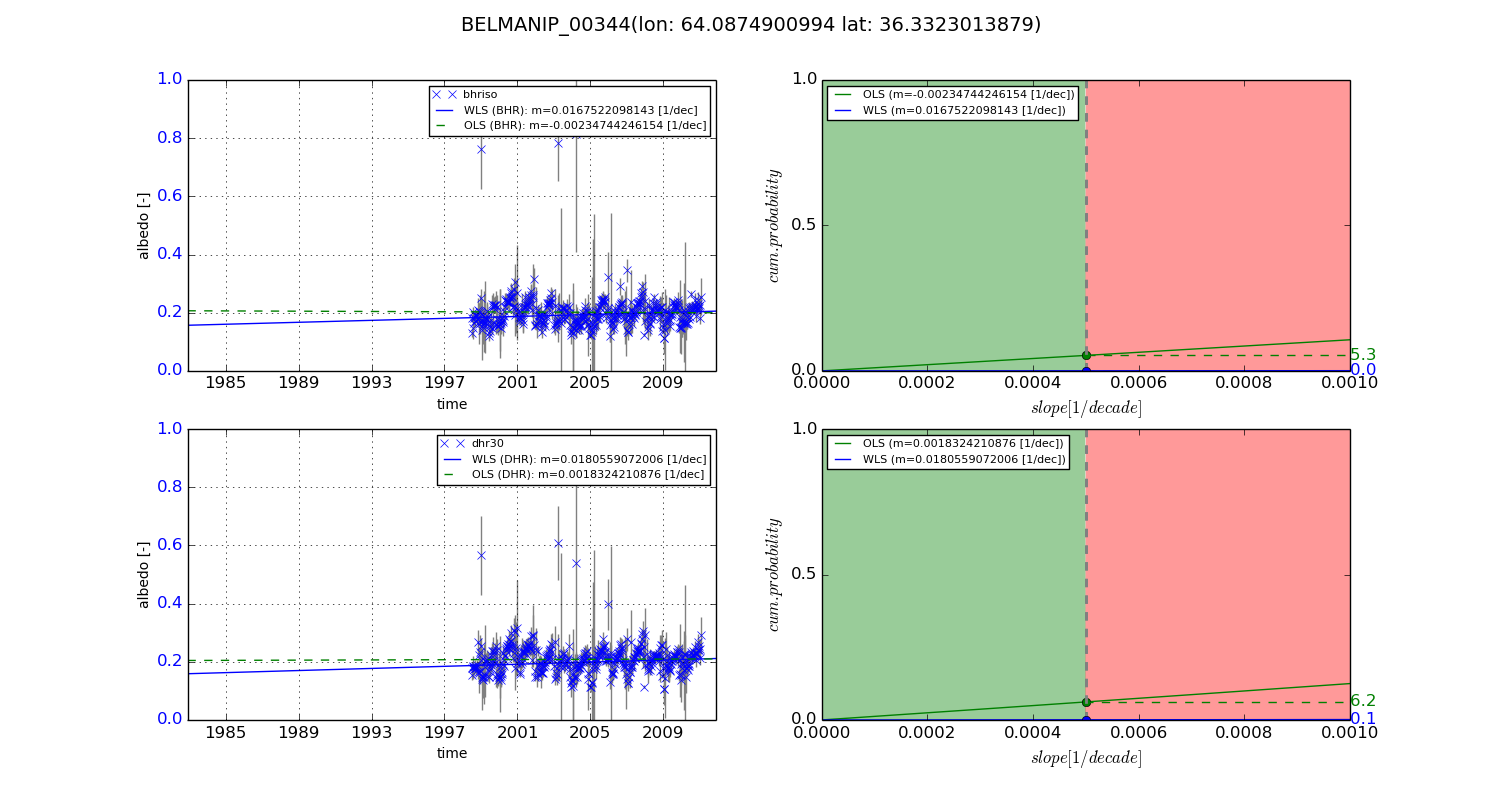
Temporal stability analysis

+000 deg (BHR)


BHR statistics

Temporal stability [1/decade]:


abs

rel


Weighted least square:

-99999.0


Ordinary least square:

-99999.0


Probabilities that GCOS criteria is met:

Weighted least square:

-99999.0 %

Ordinary least square:

-99999.0 %


DHR statistics

Temporal stability [1/decade]:


abs

rel


Weighted least square:

-99999.0


Ordinary least square:

-99999.0


Probabilities that GCOS criteria is met:

Weighted least square:

-99999.0 %

Ordinary least square:

-99999.0 %


+057/+063 deg (BHR)


BHR statistics

Temporal stability [1/decade]:


abs

rel


Weighted least square:

0.0167522098143


Ordinary least square:

-0.00234744246154


Probabilities that GCOS criteria is met:

Weighted least square:

0.0 %

Ordinary least square:

5.3 %


DHR statistics

Temporal stability [1/decade]:


abs

rel


Weighted least square:

0.0180559072006


Ordinary least square:

0.0018324210876


Probabilities that GCOS criteria is met:

Weighted least square:

0.1 %

Ordinary least square:

6.2 %


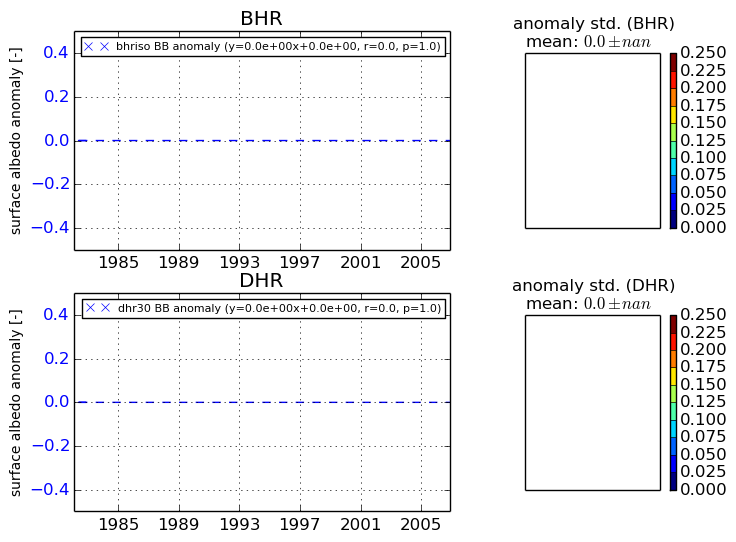
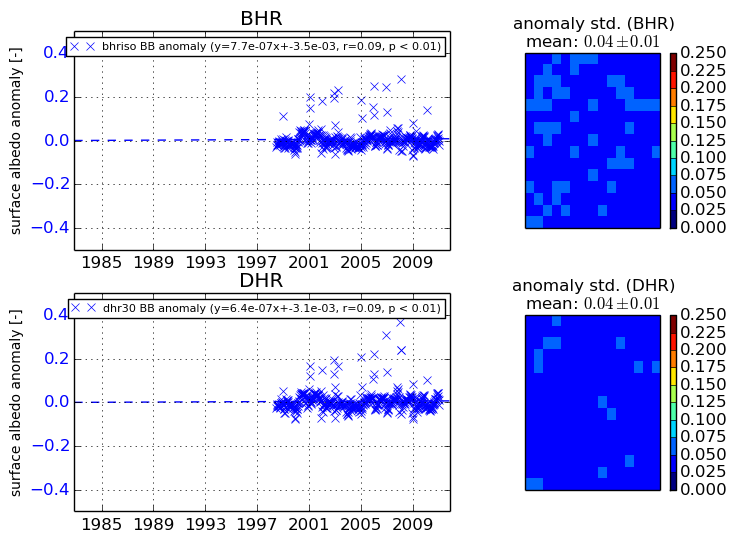
Temporal anomaly analyis

The variance of the temporal anomalies provides an additional measure about the stability of the signal AFTER removal of the mean seasonal cylce.
+000 deg


+057/+063 deg