BELMANIP_00347


Location

lon / lat [deg]: 97.5582 / 33.0128

Source network: BELMANIP


Geostationary surface albedo (GSA) data


“+000”


“+057/+063”


Landcover information (based on ESA CCI landcover data)


Landcover fractions @ 2km distance


Landcover fractions @ 20 km distance


Legend


Distance to open water bodies [km]:

35.34

Distance to urban areas [km]:

42.48


Radius: 1 km

Number of landcover classes:

4

Dominant landcover type:

130: grassland

Fraction of dominant landcover type [%]:

79.0


Radius: 2 km

Number of landcover classes:

5

Dominant landcover type:

130: grassland

Fraction of dominant landcover type [%]:

46.0


Radius: 5 km

Number of landcover classes:

5

Dominant landcover type:

130: grassland

Fraction of dominant landcover type [%]:

53.0


Radius: 10 km

Number of landcover classes:

6

Dominant landcover type:

130: grassland

Fraction of dominant landcover type [%]:

54.0


Radius: 20 km

Number of landcover classes:

6

Dominant landcover type:

130: grassland

Fraction of dominant landcover type [%]:

55.0


Disturbances


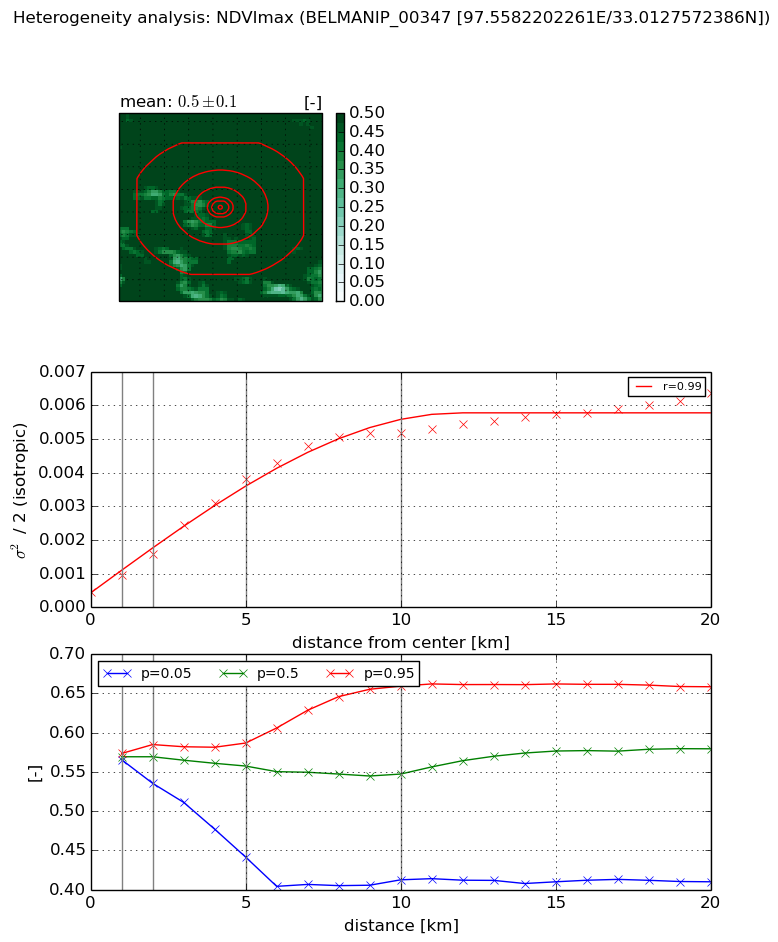
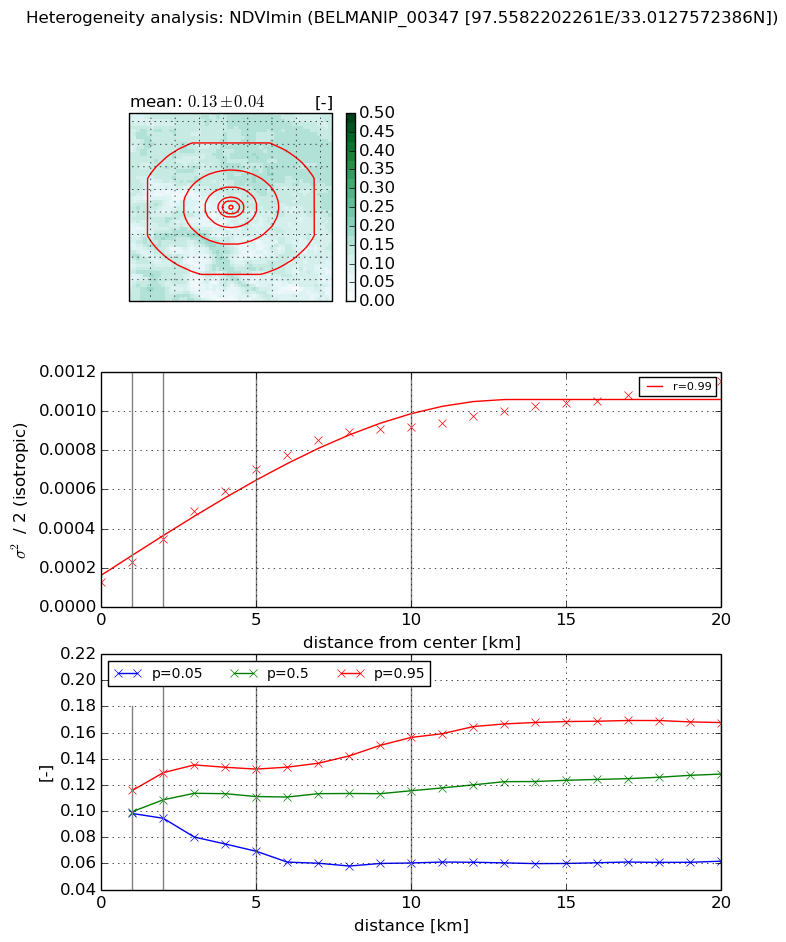
Heterogeneity analysis

The heterogeneity analysis provides information about the spatial and temporal heterogeneity of the site.

Topography


Roman et al. (2009) index


St

9.44672271607

Rcv

0.17062126694

Rse

0.0

Rst

-0.0628842744814

Rsv

-0.0840649102754


Height range @ 1km [m]

302

Height range @ 2km [m]

317

Height range @ 5km [m]

402

Height range @ 10km [m]

-999

Height range @ 20km [m]

-999


Variance slope @ 1 km

8301

Variance slope @ 2 km

6402

Variance slope @ 5 km

2466

Variance slope @ 10 km

-999

Variance slope @ 20 km

-999


NDVI (max. NDVI composite)


Roman et al. (2009) index


St

1.48275372992

Rcv

1.08728800973

Rse

0.0

Rst

-1.63147646009e-08

Rsv

-0.935974461495


NDVI range @ 1km [-]

0.01

NDVI range @ 2km [-]

0.05

NDVI range @ 5km [-]

0.15

NDVI range @ 10km [-]

0.25

NDVI range @ 20km [-]

0.25


Variance slope @ 1 km

0.000498411651299

Variance slope @ 2 km

0.000564655087998

Variance slope @ 5 km

0.000688437928546

Variance slope @ 10 km

0.000515881843115

Variance slope @ 20 km

0.000259342722026


NDVI (min. NDVI composite)I


Roman et al. (2009) index


St

0.153947605485

Rcv

0.437991113258

Rse

0.0

Rst

5.36510335743e-08

Rsv

19.049158312


NDVI range @ 1km [-]

0.02

NDVI range @ 2km [-]

0.03

NDVI range @ 5km [-]

0.06

NDVI range @ 10km [-]

0.1

NDVI range @ 20km [-]

0.11


NDVI slope @ 1 km

0.000100310706163

NDVI slope @ 2 km

0.00010887258583

NDVI slope @ 5 km

0.000117030823766

NDVI slope @ 10 km

8.3875766791e-05

NDVI slope @ 20 km

4.50054914893e-05


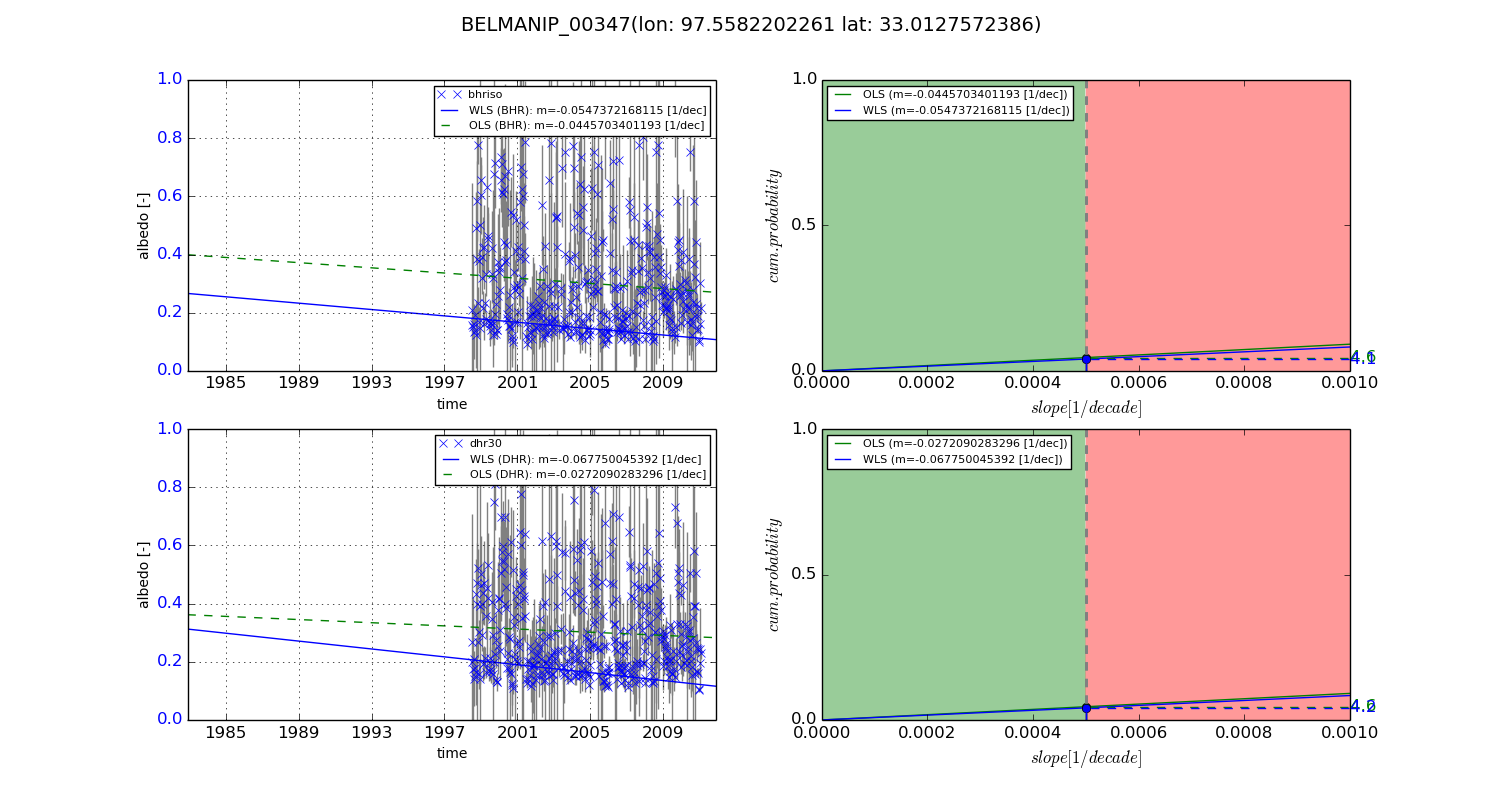
Temporal stability analysis

+000 deg (BHR)


BHR statistics

Temporal stability [1/decade]:


abs

rel


Weighted least square:

None


Ordinary least square:

None


Probabilities that GCOS criteria is met:

Weighted least square:

None %

Ordinary least square:

None %


DHR statistics

Temporal stability [1/decade]:


abs

rel


Weighted least square:

None


Ordinary least square:

None


Probabilities that GCOS criteria is met:

Weighted least square:

None %

Ordinary least square:

None %


+057/+063 deg (BHR)


BHR statistics

Temporal stability [1/decade]:


abs

rel


Weighted least square:

-0.0547372168115


Ordinary least square:

-0.0445703401193


Probabilities that GCOS criteria is met:

Weighted least square:

4.1 %

Ordinary least square:

4.6 %


DHR statistics

Temporal stability [1/decade]:


abs

rel


Weighted least square:

-0.067750045392


Ordinary least square:

-0.0272090283296


Probabilities that GCOS criteria is met:

Weighted least square:

4.2 %

Ordinary least square:

4.6 %


Temporal anomaly analyis

The variance of the temporal anomalies provides an additional measure about the stability of the signal AFTER removal of the mean seasonal cylce.

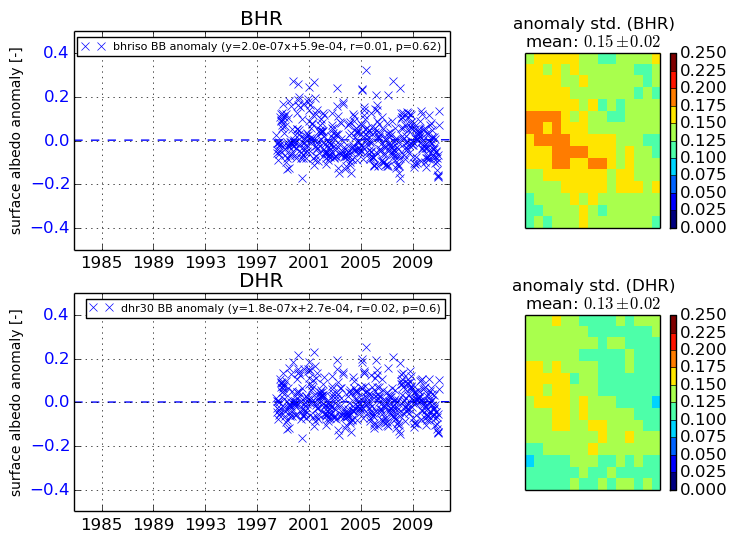
+000 deg


+057/+063 deg