BELMANIP_00349


Location

lon / lat [deg]: 99.7762 / 37.4221

Source network: BELMANIP


Geostationary surface albedo (GSA) data


“+000”


“+057/+063”


Landcover information (based on ESA CCI landcover data)


Landcover fractions @ 2km distance


Landcover fractions @ 20 km distance


Legend


Distance to open water bodies [km]:

24.59

Distance to urban areas [km]:

19.67


Radius: 1 km

Number of landcover classes:

1

Dominant landcover type:

130: grassland

Fraction of dominant landcover type [%]:

100.0


Radius: 2 km

Number of landcover classes:

3

Dominant landcover type:

130: grassland

Fraction of dominant landcover type [%]:

96.0


Radius: 5 km

Number of landcover classes:

5

Dominant landcover type:

130: grassland

Fraction of dominant landcover type [%]:

84.0


Radius: 10 km

Number of landcover classes:

5

Dominant landcover type:

130: grassland

Fraction of dominant landcover type [%]:

85.0


Radius: 20 km

Number of landcover classes:

5

Dominant landcover type:

130: grassland

Fraction of dominant landcover type [%]:

81.0


Disturbances


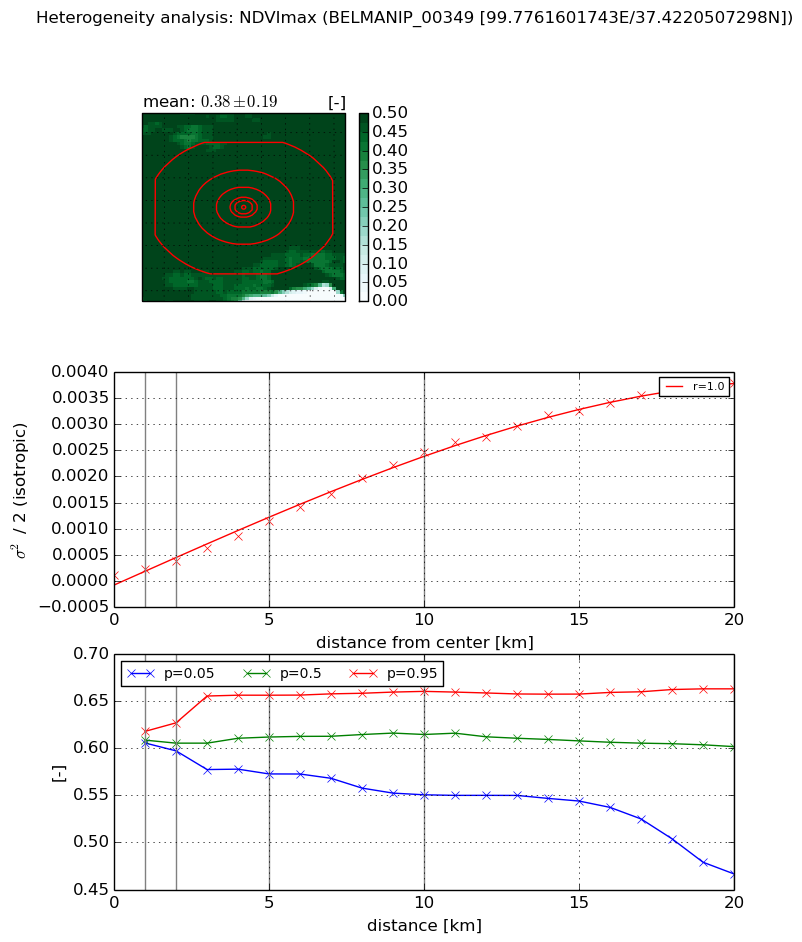
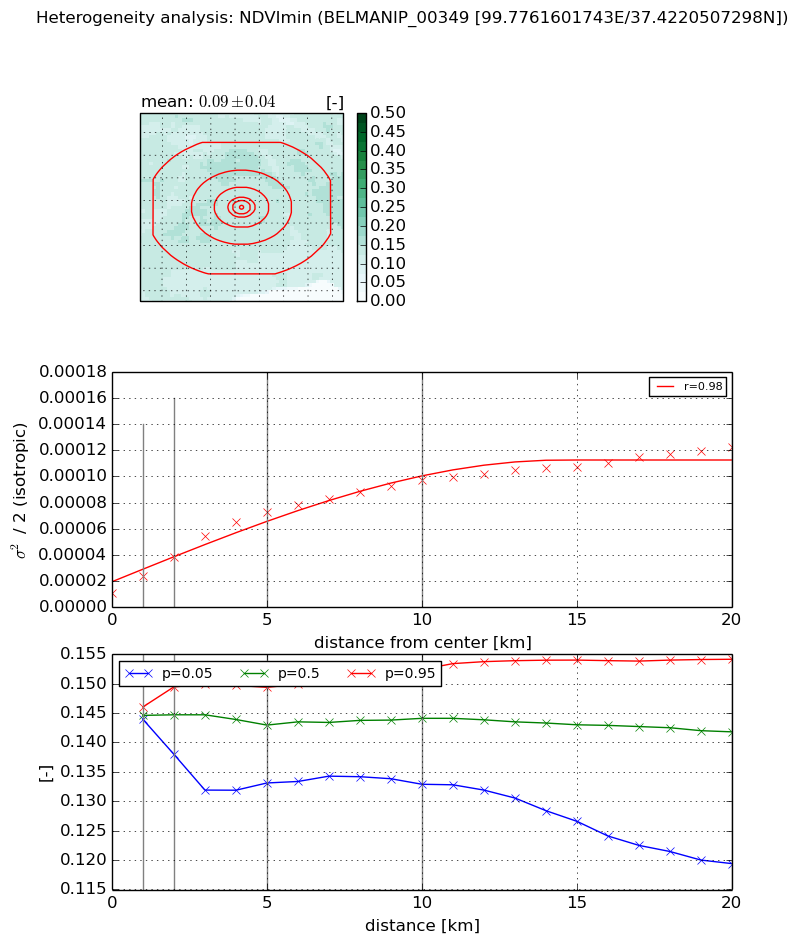
Heterogeneity analysis

The heterogeneity analysis provides information about the spatial and temporal heterogeneity of the site.

Topography


Roman et al. (2009) index


St

0.000180910406115

Rcv

0.494072032594

Rse

0.0

Rst

-0.0374633711706

Rsv

16582.2624808


Height range @ 1km [m]

116

Height range @ 2km [m]

140

Height range @ 5km [m]

305

Height range @ 10km [m]

-999

Height range @ 20km [m]

-999


Variance slope @ 1 km

2875

Variance slope @ 2 km

2549

Variance slope @ 5 km

1628

Variance slope @ 10 km

-999

Variance slope @ 20 km

-999


NDVI (max. NDVI composite)


Roman et al. (2009) index


St

2.7390844529

Rcv

0.265955445666

Rse

0.0

Rst

-0.260950951266

Rsv

0.568350084417


NDVI range @ 1km [-]

0.01

NDVI range @ 2km [-]

0.03

NDVI range @ 5km [-]

0.08

NDVI range @ 10km [-]

0.11

NDVI range @ 20km [-]

0.2


Variance slope @ 1 km

0.000115557580288

Variance slope @ 2 km

0.00013790222375

Variance slope @ 5 km

0.000209753141543

Variance slope @ 10 km

0.000247578792955

Variance slope @ 20 km

0.000198830475807


NDVI (min. NDVI composite)I


Roman et al. (2009) index


St

5.98359445706

Rcv

-0.0625820575235

Rse

0.0

Rst

0.118992104045

Rsv

-0.31979671534


NDVI range @ 1km [-]

0.0

NDVI range @ 2km [-]

0.01

NDVI range @ 5km [-]

0.02

NDVI range @ 10km [-]

0.02

NDVI range @ 20km [-]

0.03


NDVI slope @ 1 km

1.30487783981e-05

NDVI slope @ 2 km

1.35483154508e-05

NDVI slope @ 5 km

1.28006038659e-05

NDVI slope @ 10 km

8.42421853519e-06

NDVI slope @ 20 km

4.79303508174e-06


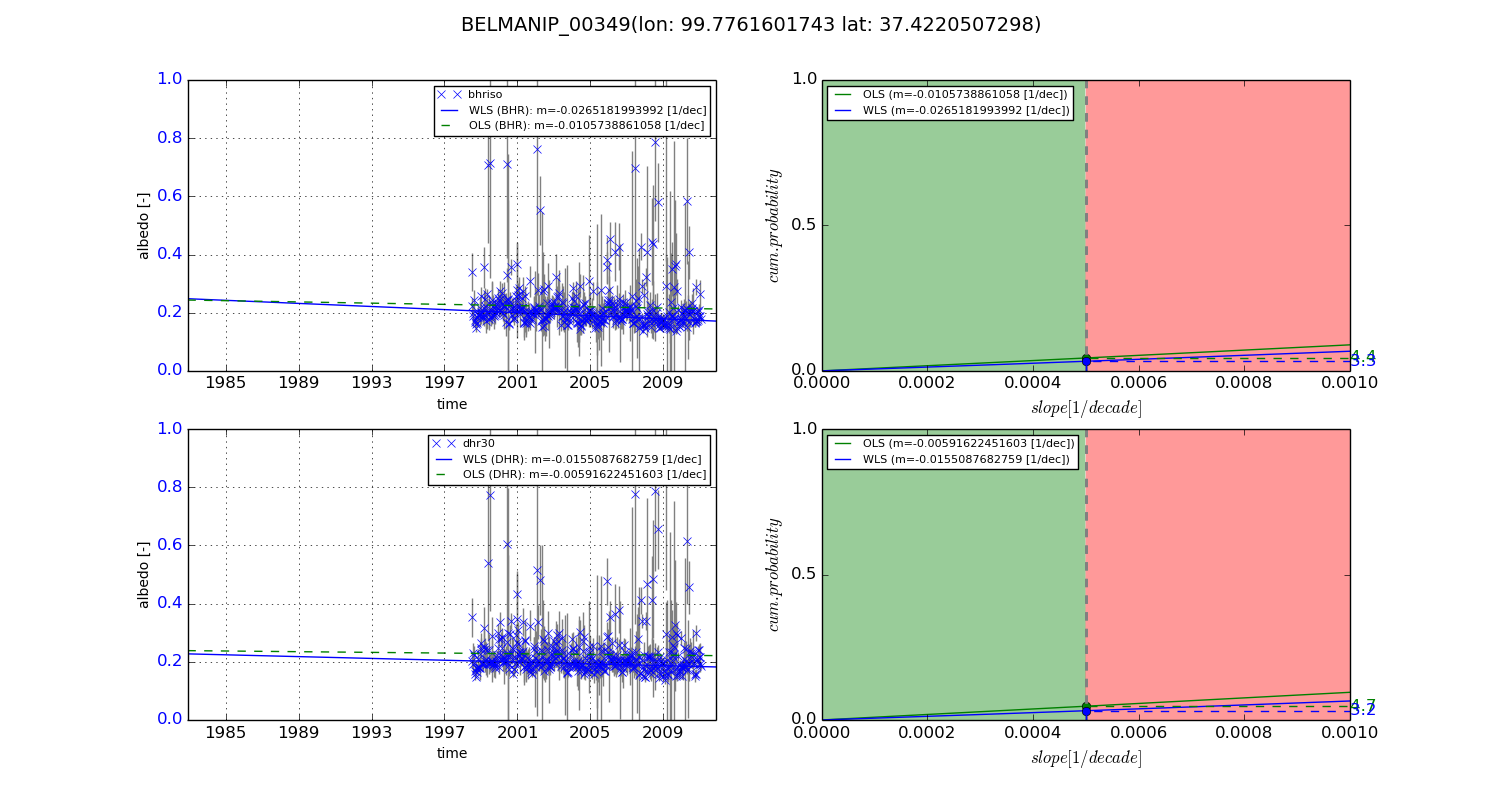
Temporal stability analysis

+000 deg (BHR)


BHR statistics

Temporal stability [1/decade]:


abs

rel


Weighted least square:

None


Ordinary least square:

None


Probabilities that GCOS criteria is met:

Weighted least square:

None %

Ordinary least square:

None %


DHR statistics

Temporal stability [1/decade]:


abs

rel


Weighted least square:

None


Ordinary least square:

None


Probabilities that GCOS criteria is met:

Weighted least square:

None %

Ordinary least square:

None %


+057/+063 deg (BHR)


BHR statistics

Temporal stability [1/decade]:


abs

rel


Weighted least square:

-0.0265181993992


Ordinary least square:

-0.0105738861058


Probabilities that GCOS criteria is met:

Weighted least square:

3.3 %

Ordinary least square:

4.4 %


DHR statistics

Temporal stability [1/decade]:


abs

rel


Weighted least square:

-0.0155087682759


Ordinary least square:

-0.00591622451603


Probabilities that GCOS criteria is met:

Weighted least square:

3.2 %

Ordinary least square:

4.7 %


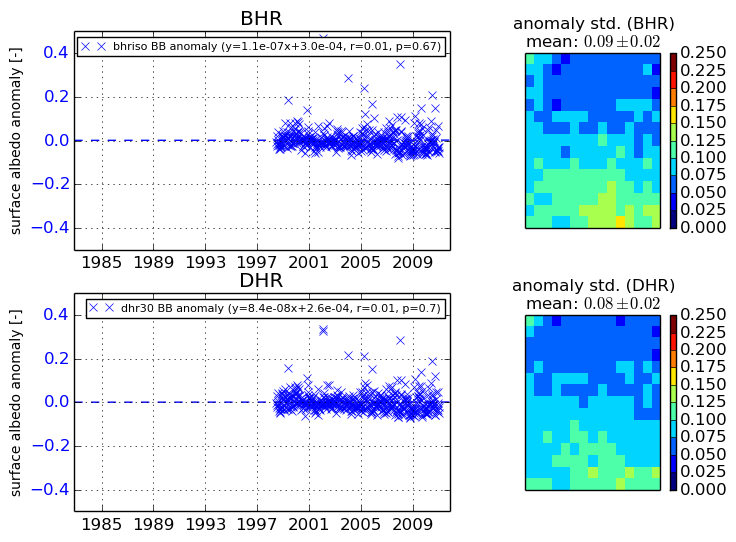
Temporal anomaly analyis

The variance of the temporal anomalies provides an additional measure about the stability of the signal AFTER removal of the mean seasonal cylce.

+000 deg


+057/+063 deg