BELMANIP_00357


Location

lon / lat [deg]: 140.036 / 36.0896

Source network: BELMANIP


Geostationary surface albedo (GSA) data


“+000”


“+057/+063”


Landcover information (based on ESA CCI landcover data)


Landcover fractions @ 2km distance


Landcover fractions @ 20 km distance


Legend


Distance to open water bodies [km]:

11.22

Distance to urban areas [km]:

2.71


Radius: 1 km

Number of landcover classes:

3

Dominant landcover type:

11: cropland, rainfed, herbaceous cover

Fraction of dominant landcover type [%]:

92.0


Radius: 2 km

Number of landcover classes:

3

Dominant landcover type:

11: cropland, rainfed, herbaceous cover

Fraction of dominant landcover type [%]:

89.0


Radius: 5 km

Number of landcover classes:

4

Dominant landcover type:

11: cropland, rainfed, herbaceous cover

Fraction of dominant landcover type [%]:

90.0


Radius: 10 km

Number of landcover classes:

4

Dominant landcover type:

11: cropland, rainfed, herbaceous cover

Fraction of dominant landcover type [%]:

82.0


Radius: 20 km

Number of landcover classes:

6

Dominant landcover type:

11: cropland, rainfed, herbaceous cover

Fraction of dominant landcover type [%]:

67.0


Disturbances


Heterogeneity analysis

The heterogeneity analysis provides information about the spatial and temporal heterogeneity of the site.

Topography


Roman et al. (2009) index


St

1.89122776527e-14

Rcv

0.579145760554

Rse

0.0

Rst

-0.0893139002413

Rsv

1.58627112772e+14


Height range @ 1km [m]

14

Height range @ 2km [m]

13

Height range @ 5km [m]

19

Height range @ 10km [m]

-999

Height range @ 20km [m]

-999


Variance slope @ 1 km

13

Variance slope @ 2 km

8

Variance slope @ 5 km

6

Variance slope @ 10 km

-999

Variance slope @ 20 km

-999


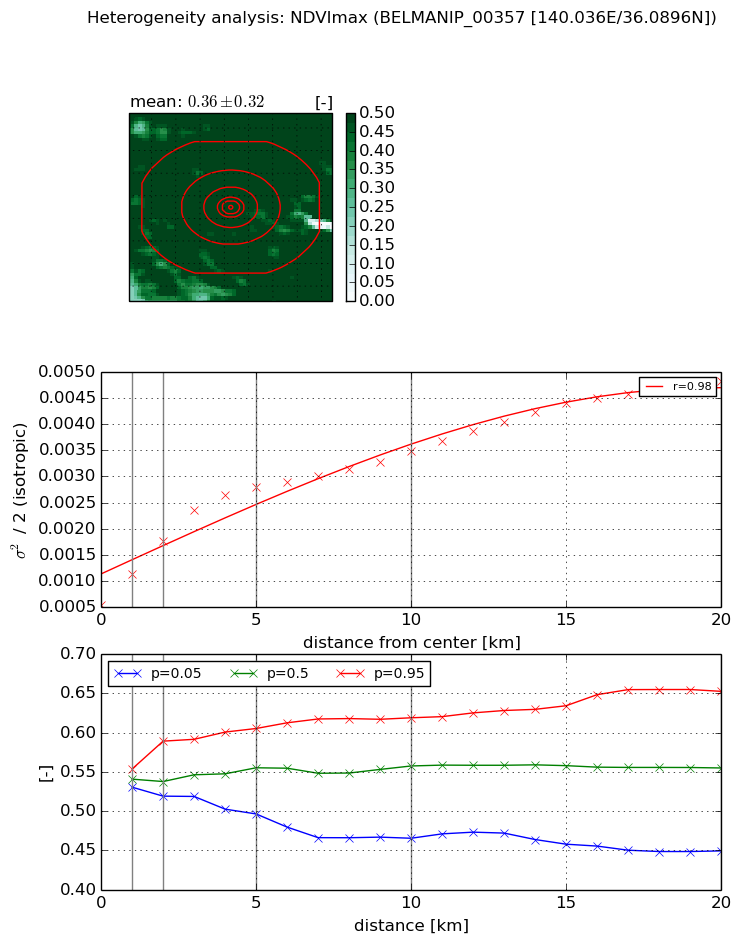
NDVI (max. NDVI composite)


Roman et al. (2009) index


St

2.88462248886

Rcv

0.358761419623

Rse

0.0

Rst

-2.59408994423e-08

Rsv

-0.681235993125


NDVI range @ 1km [-]

0.02

NDVI range @ 2km [-]

0.07

NDVI range @ 5km [-]

0.11

NDVI range @ 10km [-]

0.15

NDVI range @ 20km [-]

0.2


Variance slope @ 1 km

0.000582207542474

Variance slope @ 2 km

0.000609010027714

Variance slope @ 5 km

0.000467847848742

Variance slope @ 10 km

0.00026344705055

Variance slope @ 20 km

0.000186073358975


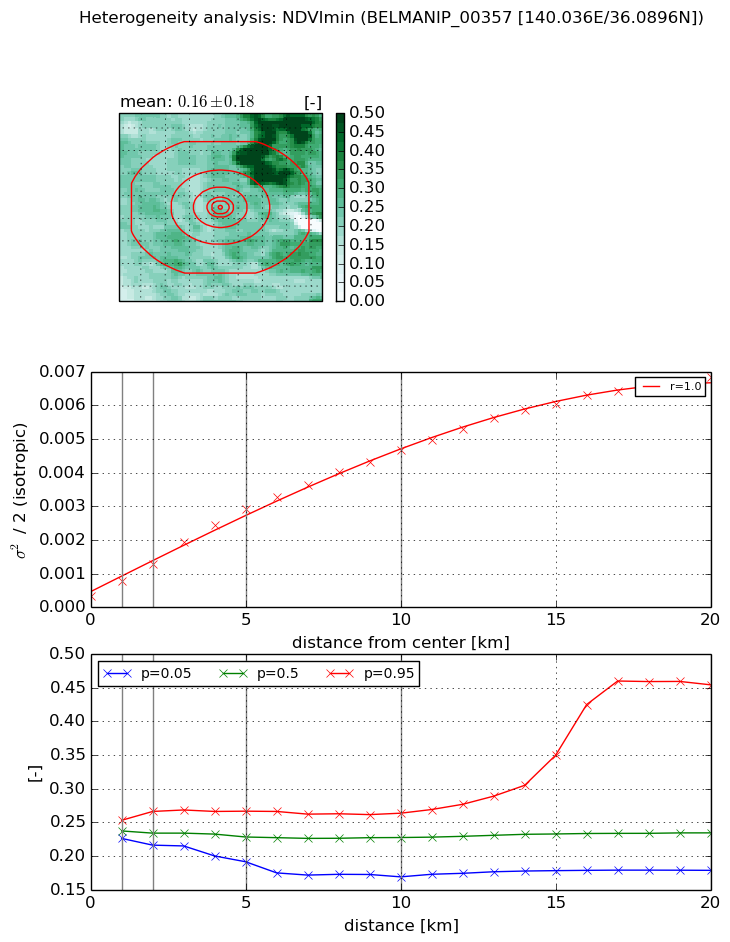
NDVI (min. NDVI composite)I


Roman et al. (2009) index


St

1.74898328364

Rcv

0.323622076034

Rse

0.0

Rst

-0.178895702802

Rsv

1.21276448147


NDVI range @ 1km [-]

0.03

NDVI range @ 2km [-]

0.05

NDVI range @ 5km [-]

0.08

NDVI range @ 10km [-]

0.09

NDVI range @ 20km [-]

0.28


NDVI slope @ 1 km

0.000427991686576

NDVI slope @ 2 km

0.000472848584708

NDVI slope @ 5 km

0.000531250957704

NDVI slope @ 10 km

0.000439809462468

NDVI slope @ 20 km

0.000323651135655


Temporal stability analysis

+000 deg (BHR)


BHR statistics

Temporal stability [1/decade]:


abs

rel


Weighted least square:

None


Ordinary least square:

None


Probabilities that GCOS criteria is met:

Weighted least square:

None %

Ordinary least square:

None %


DHR statistics

Temporal stability [1/decade]:


abs

rel


Weighted least square:

None


Ordinary least square:

None


Probabilities that GCOS criteria is met:

Weighted least square:

None %

Ordinary least square:

None %


+057/+063 deg (BHR)


BHR statistics

Temporal stability [1/decade]:


abs

rel


Weighted least square:

None


Ordinary least square:

None


Probabilities that GCOS criteria is met:

Weighted least square:

None %

Ordinary least square:

None %


DHR statistics

Temporal stability [1/decade]:


abs

rel


Weighted least square:

None


Ordinary least square:

None


Probabilities that GCOS criteria is met:

Weighted least square:

None %

Ordinary least square:

None %


Temporal anomaly analyis

The variance of the temporal anomalies provides an additional measure about the stability of the signal AFTER removal of the mean seasonal cylce.

+000 deg


+057/+063 deg