BELMANIP_00364


Location

lon / lat [deg]: 140.304 / 40.4141

Source network: BELMANIP


Geostationary surface albedo (GSA) data


“+000”


“+057/+063”


Landcover information (based on ESA CCI landcover data)


Landcover fractions @ 2km distance


Landcover fractions @ 20 km distance


Legend


Distance to open water bodies [km]:

4.34

Distance to urban areas [km]:

19.11


Radius: 1 km

Number of landcover classes:

3

Dominant landcover type:

70: Tree cover, needleleaved, evergreen, closed to open (>15%)

Fraction of dominant landcover type [%]:

60.0


Radius: 2 km

Number of landcover classes:

5

Dominant landcover type:

70: Tree cover, needleleaved, evergreen, closed to open (>15%)

Fraction of dominant landcover type [%]:

54.0


Radius: 5 km

Number of landcover classes:

5

Dominant landcover type:

61: Tree cover, broadleaved, decidous (closed > 40%)

Fraction of dominant landcover type [%]:

46.0


Radius: 10 km

Number of landcover classes:

5

Dominant landcover type:

61: Tree cover, broadleaved, decidous (closed > 40%)

Fraction of dominant landcover type [%]:

50.0


Radius: 20 km

Number of landcover classes:

6

Dominant landcover type:

70: Tree cover, needleleaved, evergreen, closed to open (>15%)

Fraction of dominant landcover type [%]:

47.0


Disturbances


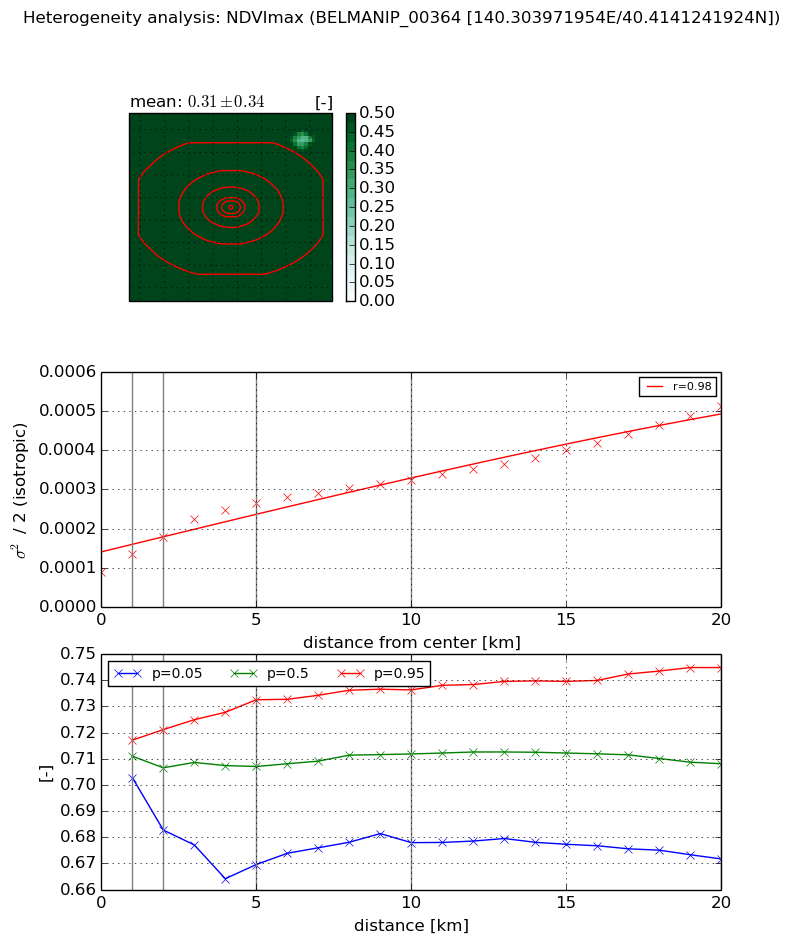
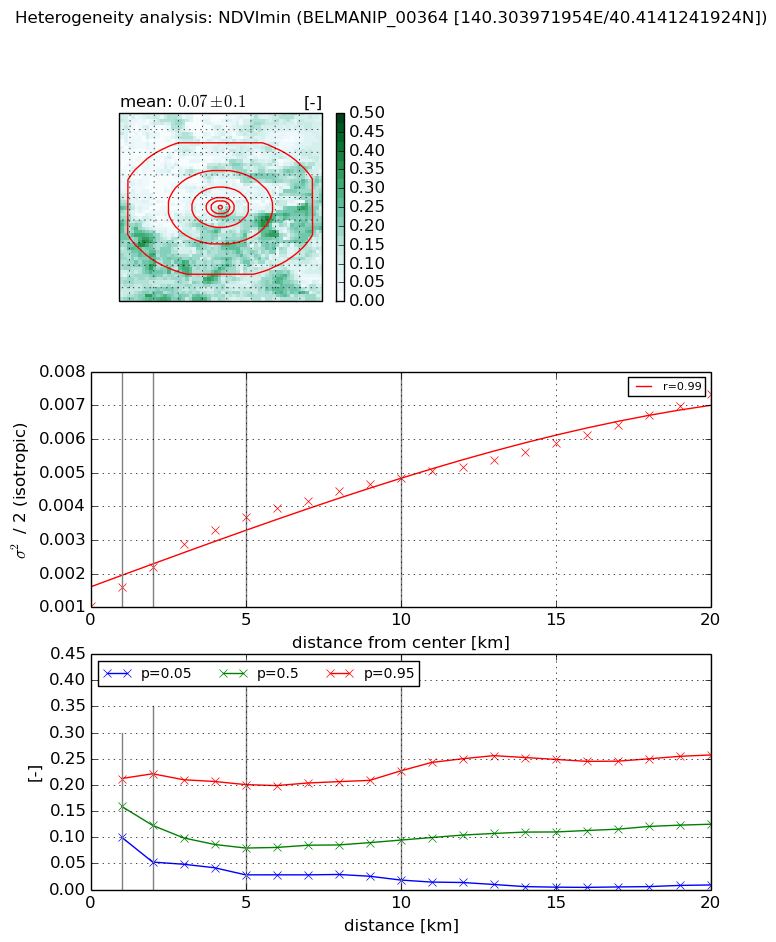
Heterogeneity analysis

The heterogeneity analysis provides information about the spatial and temporal heterogeneity of the site.

Topography


Roman et al. (2009) index


St

3.60326235017

Rcv

0.110913709315

Rse

0.0

Rst

-0.159902504875

Rsv

0.561762629217


Height range @ 1km [m]

390

Height range @ 2km [m]

487

Height range @ 5km [m]

599

Height range @ 10km [m]

-999

Height range @ 20km [m]

-999


Variance slope @ 1 km

14130

Variance slope @ 2 km

12039

Variance slope @ 5 km

5322

Variance slope @ 10 km

-999

Variance slope @ 20 km

-999


NDVI (max. NDVI composite)


Roman et al. (2009) index


St

4.17357963541

Rcv

0.151498347423

Rse

0.0

Rst

-0.0800845595335

Rsv

0.487224510672


NDVI range @ 1km [-]

0.01

NDVI range @ 2km [-]

0.04

NDVI range @ 5km [-]

0.06

NDVI range @ 10km [-]

0.06

NDVI range @ 20km [-]

0.07


Variance slope @ 1 km

4.58195182493e-05

Variance slope @ 2 km

4.49418853843e-05

Variance slope @ 5 km

3.61045608724e-05

Variance slope @ 10 km

2.20963047092e-05

Variance slope @ 20 km

1.77357202595e-05


NDVI (min. NDVI composite)I


Roman et al. (2009) index


St

3.60207482401

Rcv

0.125809391525

Rse

0.0

Rst

-0.118152881343

Rsv

0.588891053776


NDVI range @ 1km [-]

0.11

NDVI range @ 2km [-]

0.17

NDVI range @ 5km [-]

0.17

NDVI range @ 10km [-]

0.21

NDVI range @ 20km [-]

0.25


NDVI slope @ 1 km

0.000583042280922

NDVI slope @ 2 km

0.000591650272851

NDVI slope @ 5 km

0.000542819954852

NDVI slope @ 10 km

0.000375012951958

NDVI slope @ 20 km

0.000275985234736


Temporal stability analysis

+000 deg (BHR)


BHR statistics

Temporal stability [1/decade]:


abs

rel


Weighted least square:

None


Ordinary least square:

None


Probabilities that GCOS criteria is met:

Weighted least square:

None %

Ordinary least square:

None %


DHR statistics

Temporal stability [1/decade]:


abs

rel


Weighted least square:

None


Ordinary least square:

None


Probabilities that GCOS criteria is met:

Weighted least square:

None %

Ordinary least square:

None %


+057/+063 deg (BHR)


BHR statistics

Temporal stability [1/decade]:


abs

rel


Weighted least square:

None


Ordinary least square:

None


Probabilities that GCOS criteria is met:

Weighted least square:

None %

Ordinary least square:

None %


DHR statistics

Temporal stability [1/decade]:


abs

rel


Weighted least square:

None


Ordinary least square:

None


Probabilities that GCOS criteria is met:

Weighted least square:

None %

Ordinary least square:

None %


Temporal anomaly analyis

The variance of the temporal anomalies provides an additional measure about the stability of the signal AFTER removal of the mean seasonal cylce.

+000 deg


+057/+063 deg