BELMANIP_00365


Location

lon / lat [deg]: 81.4277 / 42.9289

Source network: BELMANIP


Geostationary surface albedo (GSA) data


“+000”


“+057/+063”


Landcover information (based on ESA CCI landcover data)


Landcover fractions @ 2km distance


Landcover fractions @ 20 km distance


Legend


Distance to open water bodies [km]:

21.34

Distance to urban areas [km]:

7.41


Radius: 1 km

Number of landcover classes:

1

Dominant landcover type:

20: cropland, irrigated or post-flooded

Fraction of dominant landcover type [%]:

100.0


Radius: 2 km

Number of landcover classes:

4

Dominant landcover type:

20: cropland, irrigated or post-flooded

Fraction of dominant landcover type [%]:

87.0


Radius: 5 km

Number of landcover classes:

4

Dominant landcover type:

20: cropland, irrigated or post-flooded

Fraction of dominant landcover type [%]:

61.0


Radius: 10 km

Number of landcover classes:

6

Dominant landcover type:

20: cropland, irrigated or post-flooded

Fraction of dominant landcover type [%]:

60.0


Radius: 20 km

Number of landcover classes:

8

Dominant landcover type:

20: cropland, irrigated or post-flooded

Fraction of dominant landcover type [%]:

55.0


Disturbances


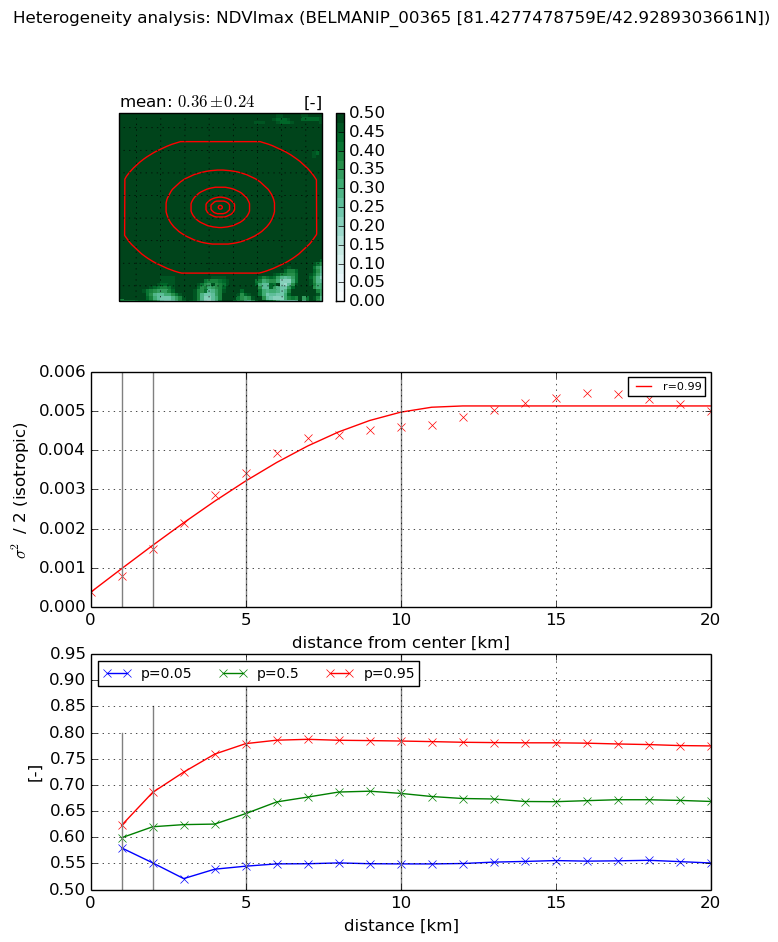
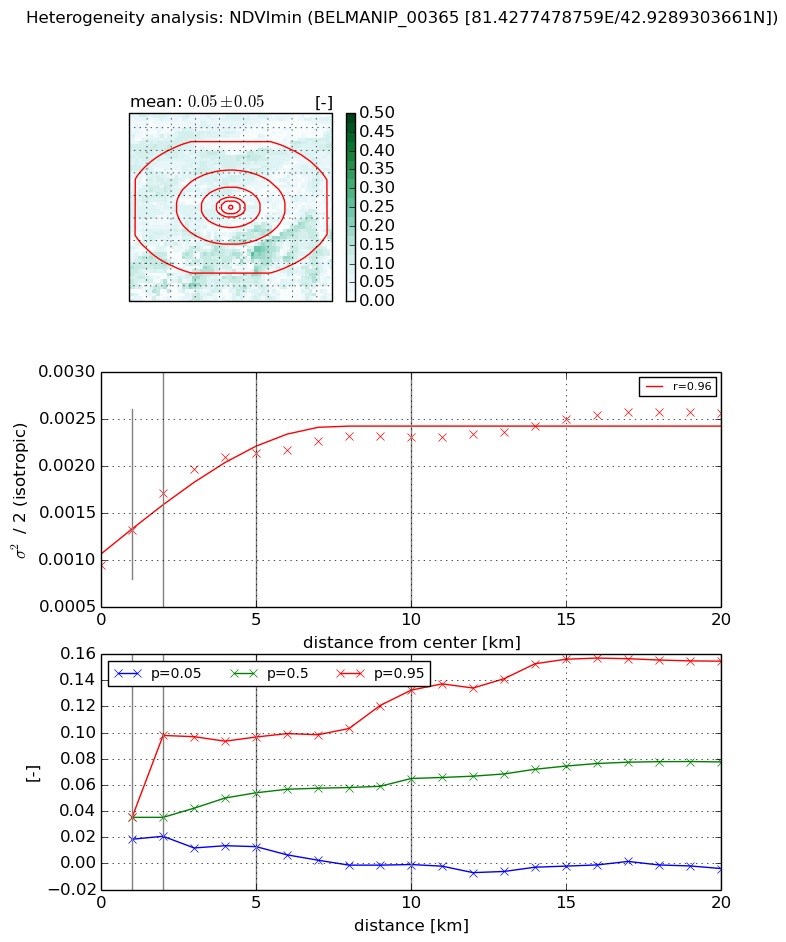
Heterogeneity analysis

The heterogeneity analysis provides information about the spatial and temporal heterogeneity of the site.

Topography


Roman et al. (2009) index


St

2.67625763724e-10

Rcv

0.790050939439

Rse

0.0

Rst

1.63045730917e-07

Rsv

11209683096.5


Height range @ 1km [m]

113

Height range @ 2km [m]

166

Height range @ 5km [m]

394

Height range @ 10km [m]

-999

Height range @ 20km [m]

-999


Variance slope @ 1 km

1771

Variance slope @ 2 km

2058

Variance slope @ 5 km

2887

Variance slope @ 10 km

-999

Variance slope @ 20 km

-999


NDVI (max. NDVI composite)


Roman et al. (2009) index


St

8.48721257688

Rcv

0.151872492792

Rse

0.0

Rst

-0.0288170667199

Rsv

0.172783382614


NDVI range @ 1km [-]

0.04

NDVI range @ 2km [-]

0.13

NDVI range @ 5km [-]

0.23

NDVI range @ 10km [-]

0.24

NDVI range @ 20km [-]

0.22


Variance slope @ 1 km

0.000426160124097

Variance slope @ 2 km

0.000547121343062

Variance slope @ 5 km

0.000629551397264

Variance slope @ 10 km

0.000454978586089

Variance slope @ 20 km

0.000224287635386


NDVI (min. NDVI composite)I


Roman et al. (2009) index


St

nan

Rcv

nan

Rse

nan

Rst

nan

Rsv

nan


NDVI range @ 1km [-]

0.02

NDVI range @ 2km [-]

0.08

NDVI range @ 5km [-]

0.08

NDVI range @ 10km [-]

0.13

NDVI range @ 20km [-]

0.16


NDVI slope @ 1 km

0.000378671862513

NDVI slope @ 2 km

0.000382692207563

NDVI slope @ 5 km

0.000245130536631

NDVI slope @ 10 km

0.000120796918502

NDVI slope @ 20 km

5.77573027697e-05


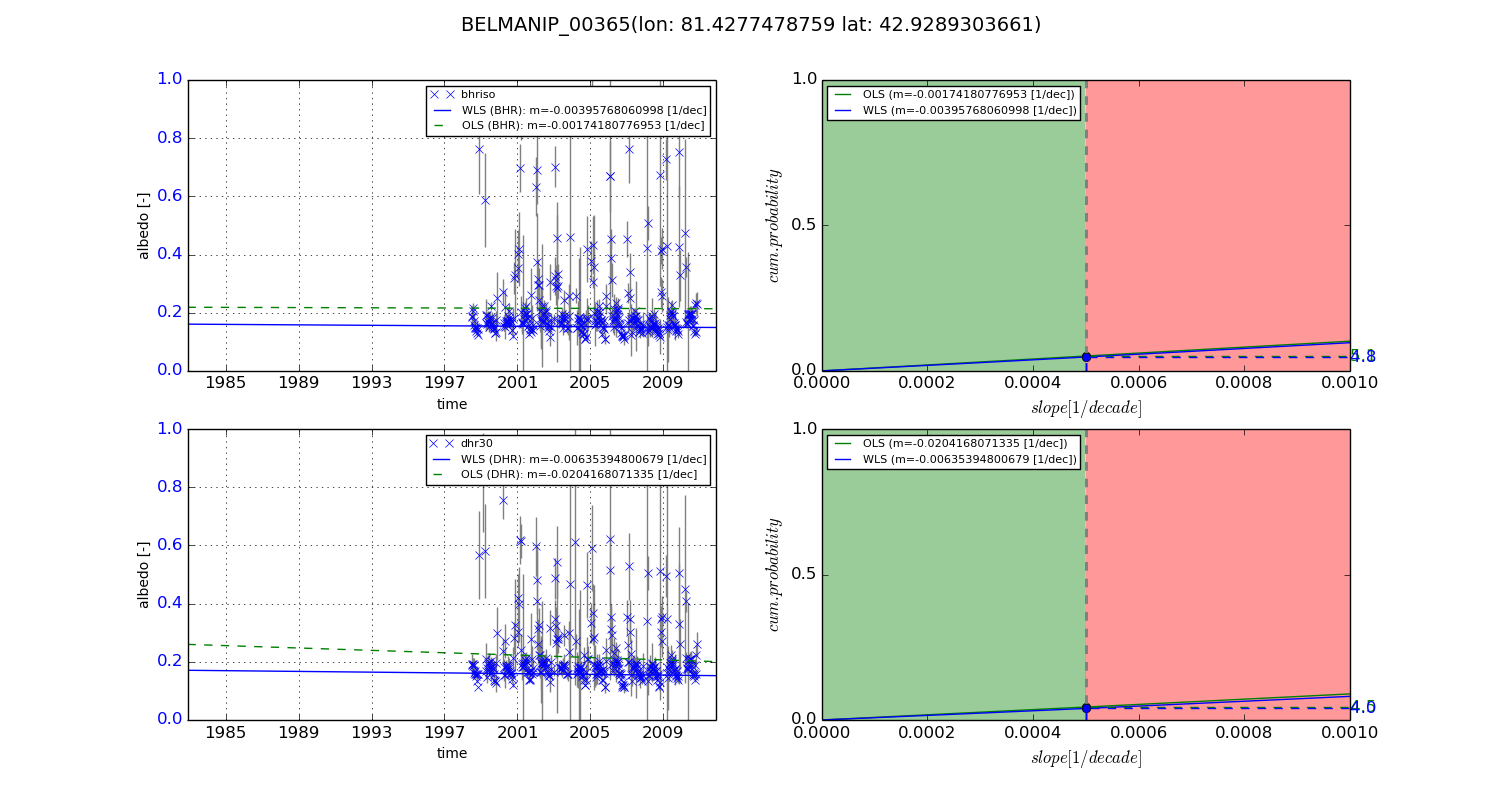
Temporal stability analysis

+000 deg (BHR)


BHR statistics

Temporal stability [1/decade]:


abs

rel


Weighted least square:

None


Ordinary least square:

None


Probabilities that GCOS criteria is met:

Weighted least square:

None %

Ordinary least square:

None %


DHR statistics

Temporal stability [1/decade]:


abs

rel


Weighted least square:

None


Ordinary least square:

None


Probabilities that GCOS criteria is met:

Weighted least square:

None %

Ordinary least square:

None %


+057/+063 deg (BHR)


BHR statistics

Temporal stability [1/decade]:


abs

rel


Weighted least square:

-0.00395768060998


Ordinary least square:

-0.00174180776953


Probabilities that GCOS criteria is met:

Weighted least square:

4.8 %

Ordinary least square:

5.1 %


DHR statistics

Temporal stability [1/decade]:


abs

rel


Weighted least square:

-0.00635394800679


Ordinary least square:

-0.0204168071335


Probabilities that GCOS criteria is met:

Weighted least square:

4.0 %

Ordinary least square:

4.5 %


Temporal anomaly analyis

The variance of the temporal anomalies provides an additional measure about the stability of the signal AFTER removal of the mean seasonal cylce.

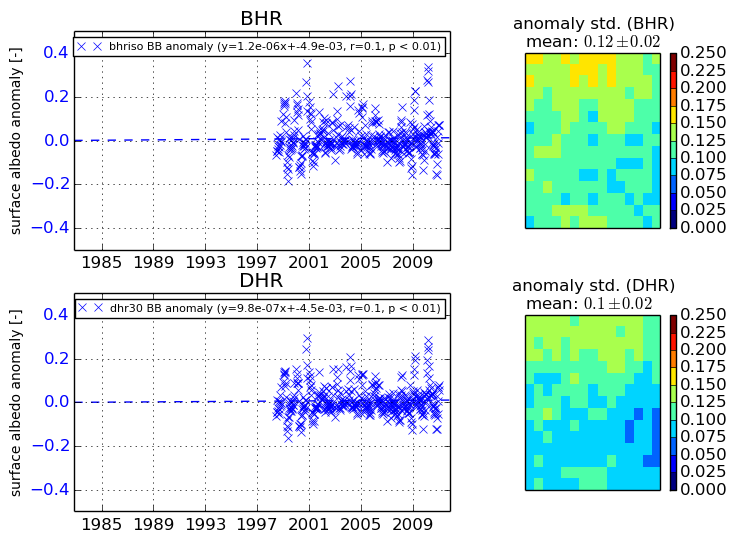
+000 deg


+057/+063 deg