BELMANIP_00369


Location

lon / lat [deg]: 97.3566 / 47.1706

Source network: BELMANIP


Geostationary surface albedo (GSA) data


“+000”


“+057/+063”


Landcover information (based on ESA CCI landcover data)


Landcover fractions @ 2km distance


Landcover fractions @ 20 km distance


Legend


Distance to open water bodies [km]:

10.93

Distance to urban areas [km]:

none in region


Radius: 1 km

Number of landcover classes:

1

Dominant landcover type:

130: grassland

Fraction of dominant landcover type [%]:

100.0


Radius: 2 km

Number of landcover classes:

1

Dominant landcover type:

130: grassland

Fraction of dominant landcover type [%]:

100.0


Radius: 5 km

Number of landcover classes:

1

Dominant landcover type:

130: grassland

Fraction of dominant landcover type [%]:

100.0


Radius: 10 km

Number of landcover classes:

1

Dominant landcover type:

130: grassland

Fraction of dominant landcover type [%]:

100.0


Radius: 20 km

Number of landcover classes:

2

Dominant landcover type:

130: grassland

Fraction of dominant landcover type [%]:

97.0


Disturbances


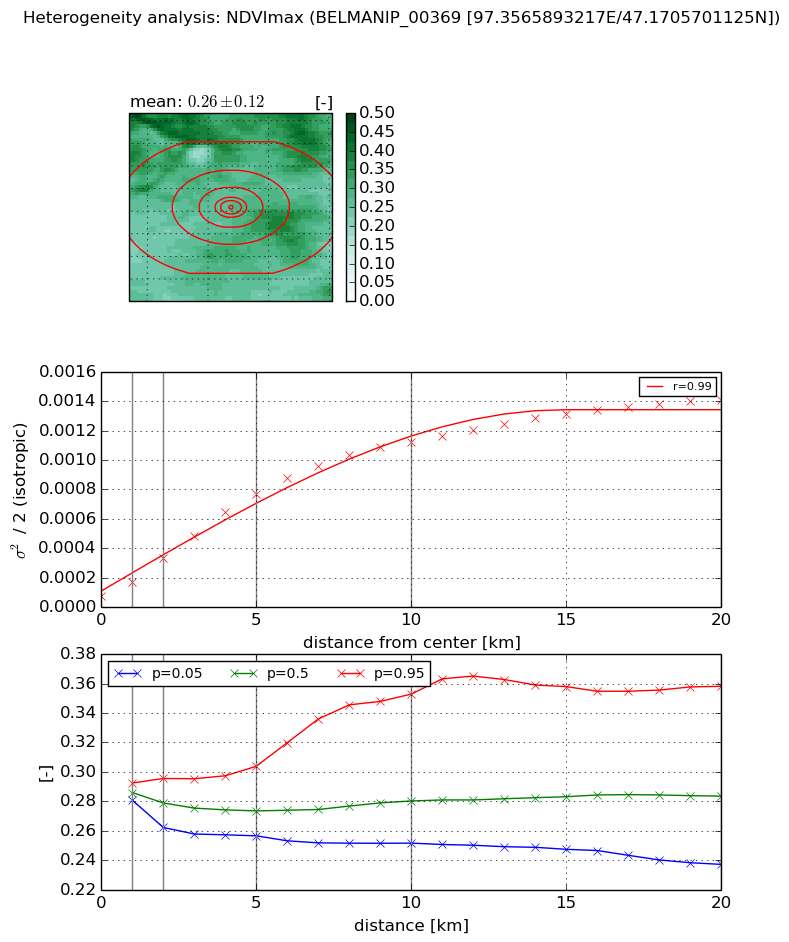
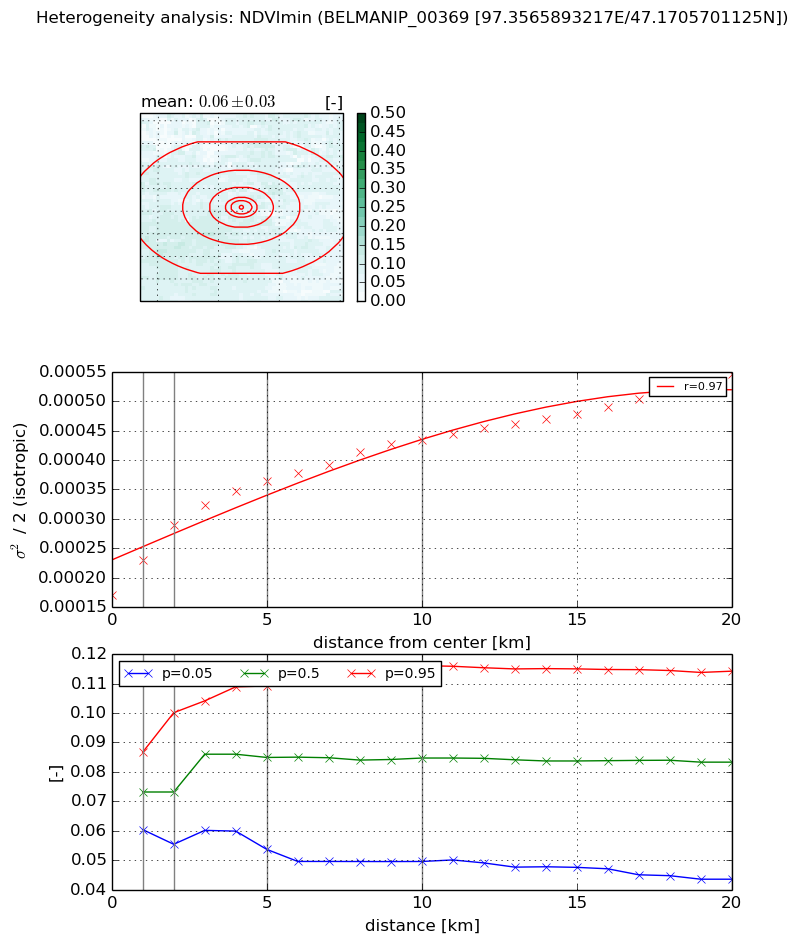
Heterogeneity analysis

The heterogeneity analysis provides information about the spatial and temporal heterogeneity of the site.

Topography


Roman et al. (2009) index


St

3.5565666637e-05

Rcv

0.231564712145

Rse

0.0

Rst

0.02666265065

Rsv

84350.7545238


Height range @ 1km [m]

175

Height range @ 2km [m]

182

Height range @ 5km [m]

269

Height range @ 10km [m]

-999

Height range @ 20km [m]

-999


Variance slope @ 1 km

1658

Variance slope @ 2 km

1835

Variance slope @ 5 km

1657

Variance slope @ 10 km

-999

Variance slope @ 20 km

-999


NDVI (max. NDVI composite)


Roman et al. (2009) index


St

3.0399675121

Rcv

0.263712397133

Rse

0.0

Rst

-0.165459339538

Rsv

0.5576809149


NDVI range @ 1km [-]

0.01

NDVI range @ 2km [-]

0.03

NDVI range @ 5km [-]

0.05

NDVI range @ 10km [-]

0.1

NDVI range @ 20km [-]

0.12


Variance slope @ 1 km

9.33220229474e-05

Variance slope @ 2 km

0.000128938046145

Variance slope @ 5 km

0.000143027985749

Variance slope @ 10 km

0.000110765025374

Variance slope @ 20 km

6.31247028812e-05


NDVI (min. NDVI composite)I


Roman et al. (2009) index


St

0.528144668663

Rcv

0.0470928236362

Rse

0.0

Rst

-2.18532763225

Rsv

3.44784137009


NDVI range @ 1km [-]

0.03

NDVI range @ 2km [-]

0.04

NDVI range @ 5km [-]

0.06

NDVI range @ 10km [-]

0.07

NDVI range @ 20km [-]

0.07


NDVI slope @ 1 km

5.83526269862e-05

NDVI slope @ 2 km

5.93507709382e-05

NDVI slope @ 5 km

3.86030988575e-05

NDVI slope @ 10 km

2.41135013887e-05

NDVI slope @ 20 km

1.51615342984e-05


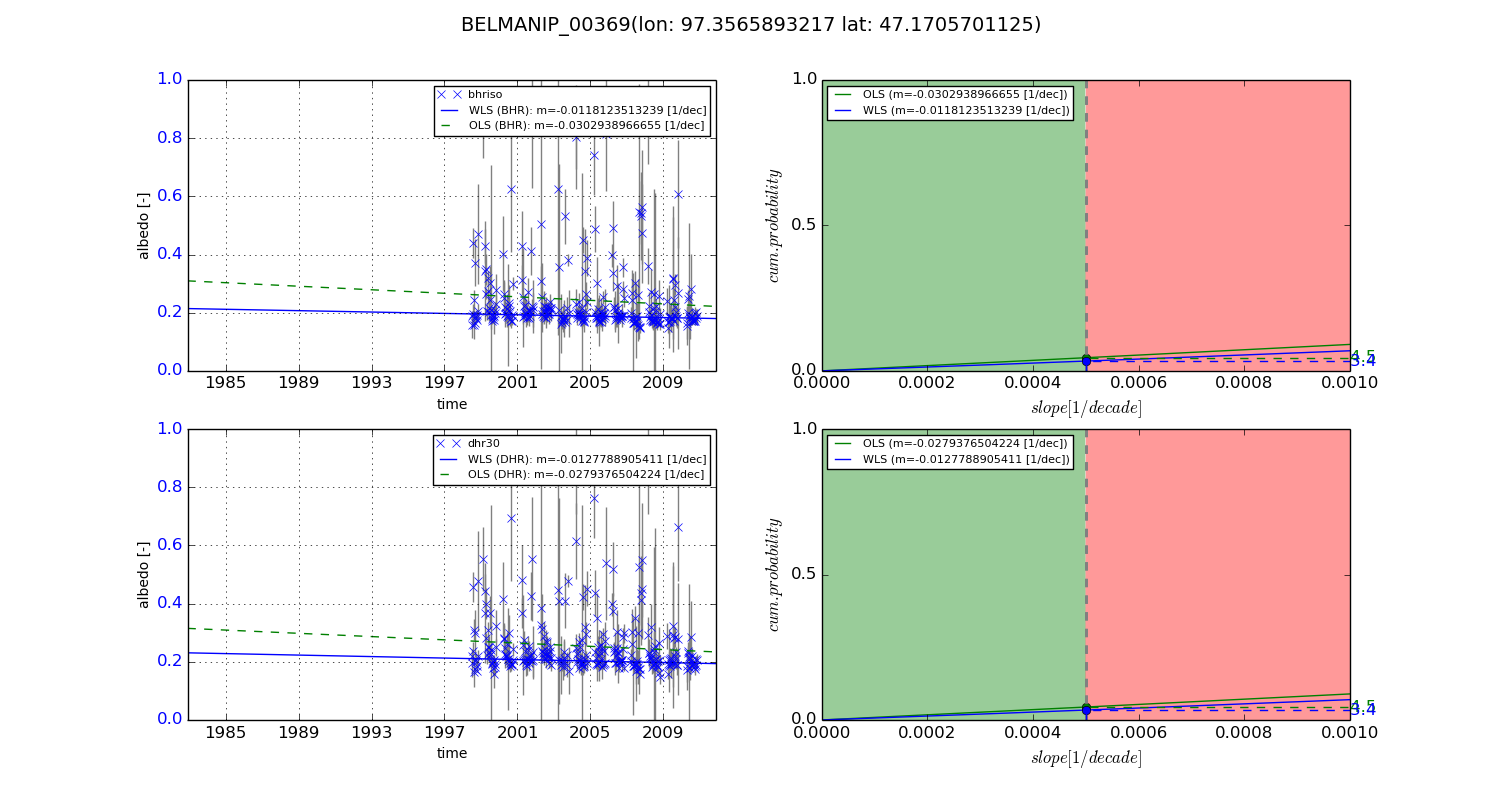
Temporal stability analysis

+000 deg (BHR)


BHR statistics

Temporal stability [1/decade]:


abs

rel


Weighted least square:

None


Ordinary least square:

None


Probabilities that GCOS criteria is met:

Weighted least square:

None %

Ordinary least square:

None %


DHR statistics

Temporal stability [1/decade]:


abs

rel


Weighted least square:

None


Ordinary least square:

None


Probabilities that GCOS criteria is met:

Weighted least square:

None %

Ordinary least square:

None %


+057/+063 deg (BHR)


BHR statistics

Temporal stability [1/decade]:


abs

rel


Weighted least square:

-0.0118123513239


Ordinary least square:

-0.0302938966655


Probabilities that GCOS criteria is met:

Weighted least square:

3.4 %

Ordinary least square:

4.5 %


DHR statistics

Temporal stability [1/decade]:


abs

rel


Weighted least square:

-0.0127788905411


Ordinary least square:

-0.0279376504224


Probabilities that GCOS criteria is met:

Weighted least square:

3.4 %

Ordinary least square:

4.5 %


Temporal anomaly analyis

The variance of the temporal anomalies provides an additional measure about the stability of the signal AFTER removal of the mean seasonal cylce.

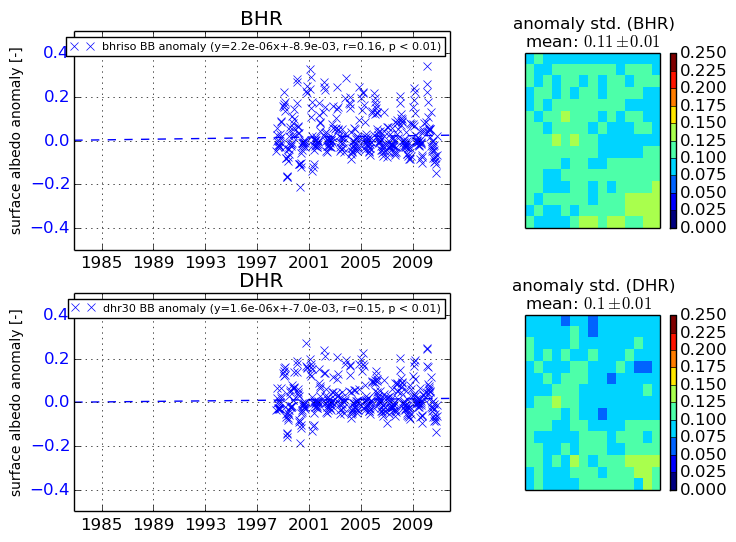
+000 deg


+057/+063 deg