BELMANIP_00375


Location

lon / lat [deg]: 62.8777 / 40.6656

Source network: BELMANIP


Geostationary surface albedo (GSA) data


“+000”


“+057/+063”


Landcover information (based on ESA CCI landcover data)


Landcover fractions @ 2km distance


Landcover fractions @ 20 km distance


Legend


Distance to open water bodies [km]:

40.02

Distance to urban areas [km]:

42.85


Radius: 1 km

Number of landcover classes:

1

Dominant landcover type:

200: bare areas

Fraction of dominant landcover type [%]:

100.0


Radius: 2 km

Number of landcover classes:

1

Dominant landcover type:

200: bare areas

Fraction of dominant landcover type [%]:

100.0


Radius: 5 km

Number of landcover classes:

1

Dominant landcover type:

200: bare areas

Fraction of dominant landcover type [%]:

100.0


Radius: 10 km

Number of landcover classes:

1

Dominant landcover type:

200: bare areas

Fraction of dominant landcover type [%]:

100.0


Radius: 20 km

Number of landcover classes:

1

Dominant landcover type:

200: bare areas

Fraction of dominant landcover type [%]:

100.0


Disturbances


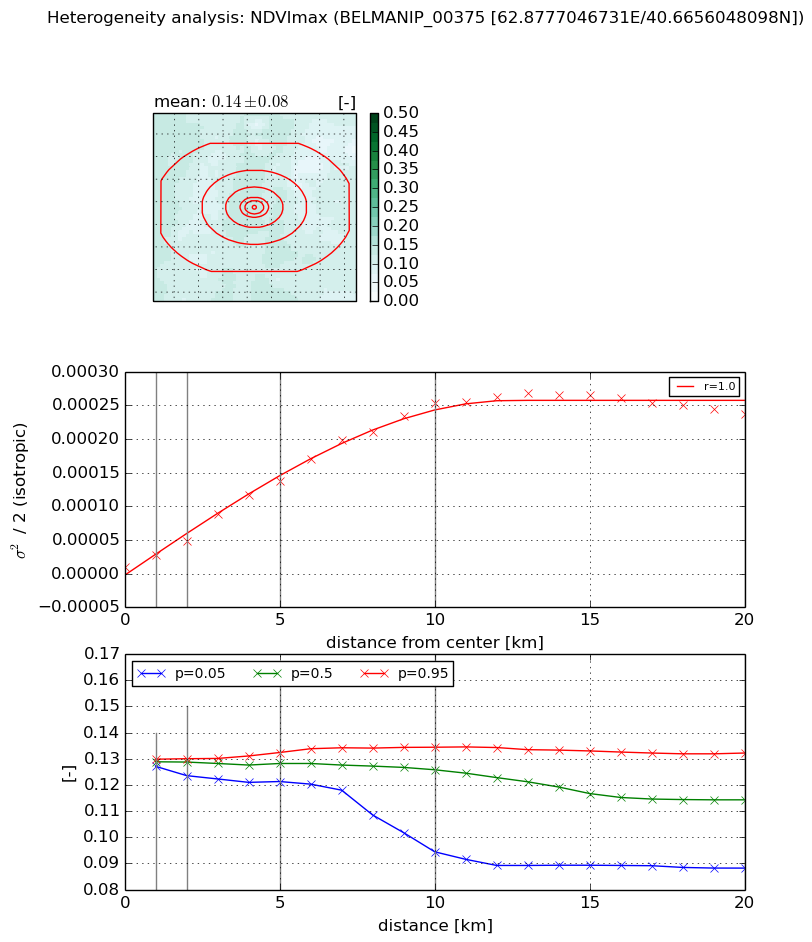
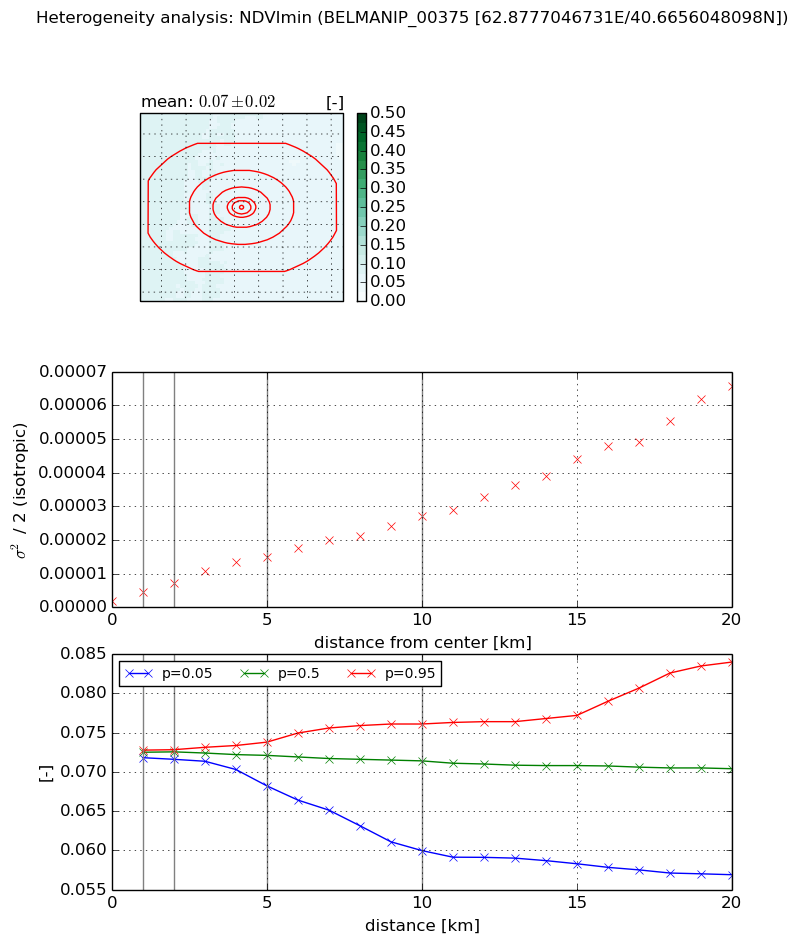
Heterogeneity analysis

The heterogeneity analysis provides information about the spatial and temporal heterogeneity of the site.

Topography


Roman et al. (2009) index


St

4.46195912402

Rcv

0.0697448955732

Rse

0.0

Rst

-0.113481271131

Rsv

-0.489124232889


Height range @ 1km [m]

5

Height range @ 2km [m]

6

Height range @ 5km [m]

7

Height range @ 10km [m]

-999

Height range @ 20km [m]

-999


Variance slope @ 1 km

2

Variance slope @ 2 km

1

Variance slope @ 5 km

0

Variance slope @ 10 km

-999

Variance slope @ 20 km

-999


NDVI (max. NDVI composite)


Roman et al. (2009) index


St

3.78635949302

Rcv

0.286788706258

Rse

0.0

Rst

-0.122439146216

Rsv

0.383089941315


NDVI range @ 1km [-]

0.0

NDVI range @ 2km [-]

0.01

NDVI range @ 5km [-]

0.01

NDVI range @ 10km [-]

0.04

NDVI range @ 20km [-]

0.04


Variance slope @ 1 km

1.78492061963e-05

Variance slope @ 2 km

1.91140426452e-05

Variance slope @ 5 km

2.70577505968e-05

Variance slope @ 10 km

2.54038389283e-05

Variance slope @ 20 km

1.19806492269e-05


NDVI (min. NDVI composite)I


Roman et al. (2009) index


St

0.793398088527

Rcv

1.79802664813

Rse

0.0

Rst

3.78703265845e-09

Rsv

1.9831773154


NDVI range @ 1km [-]

0.0

NDVI range @ 2km [-]

0.0

NDVI range @ 5km [-]

0.01

NDVI range @ 10km [-]

0.02

NDVI range @ 20km [-]

0.03


NDVI slope @ 1 km

2.5989580664e-06

NDVI slope @ 2 km

2.55772764553e-06

NDVI slope @ 5 km

2.70923633969e-06

NDVI slope @ 10 km

2.44428235341e-06

NDVI slope @ 20 km

3.0177011142e-06


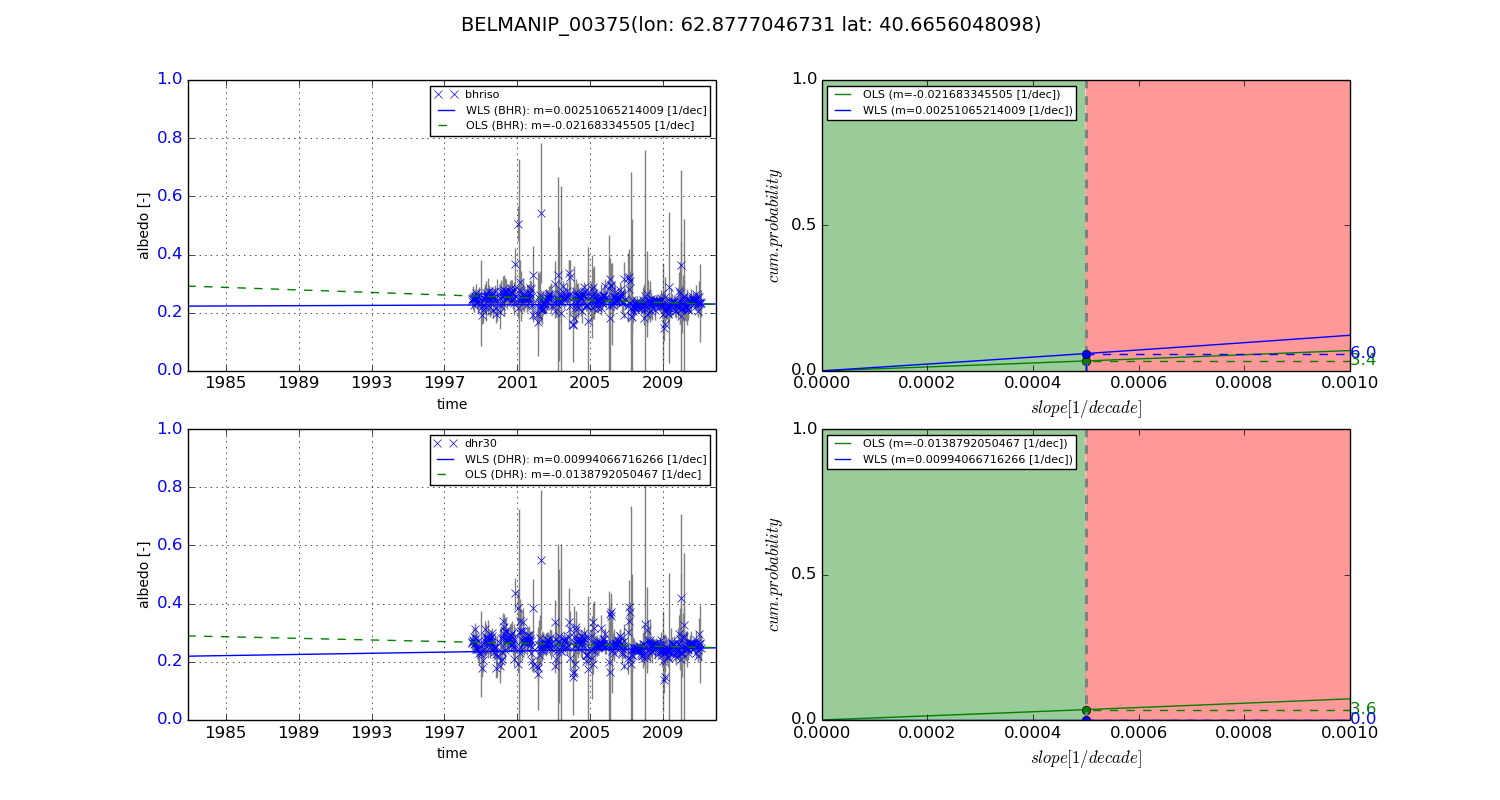
Temporal stability analysis

+000 deg (BHR)


BHR statistics

Temporal stability [1/decade]:


abs

rel


Weighted least square:

-99999.0


Ordinary least square:

-99999.0


Probabilities that GCOS criteria is met:

Weighted least square:

-99999.0 %

Ordinary least square:

-99999.0 %


DHR statistics

Temporal stability [1/decade]:


abs

rel


Weighted least square:

-99999.0


Ordinary least square:

-99999.0


Probabilities that GCOS criteria is met:

Weighted least square:

-99999.0 %

Ordinary least square:

-99999.0 %


+057/+063 deg (BHR)


BHR statistics

Temporal stability [1/decade]:


abs

rel


Weighted least square:

0.00251065214009


Ordinary least square:

-0.021683345505


Probabilities that GCOS criteria is met:

Weighted least square:

6.0 %

Ordinary least square:

3.4 %


DHR statistics

Temporal stability [1/decade]:


abs

rel


Weighted least square:

0.00994066716266


Ordinary least square:

-0.0138792050467


Probabilities that GCOS criteria is met:

Weighted least square:

0.0 %

Ordinary least square:

3.6 %


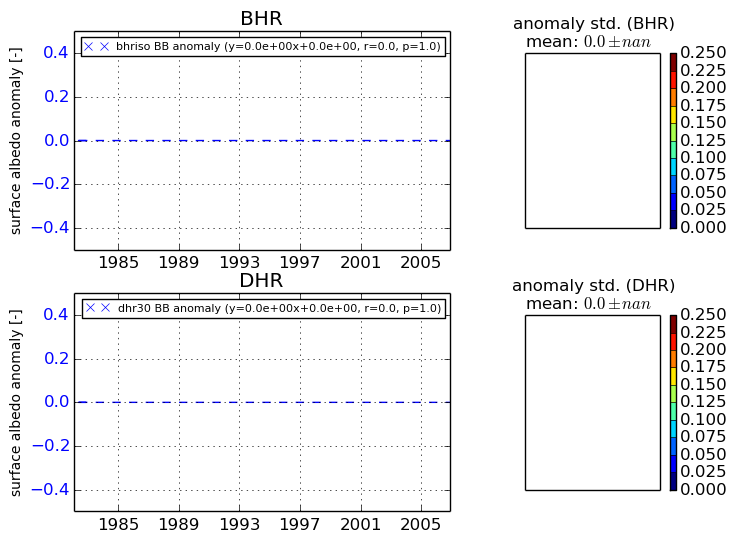
Temporal anomaly analyis

The variance of the temporal anomalies provides an additional measure about the stability of the signal AFTER removal of the mean seasonal cylce.
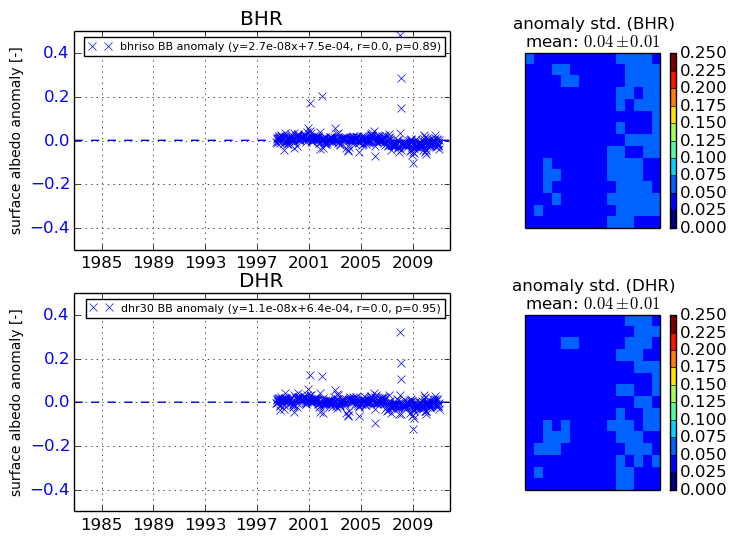
+000 deg


+057/+063 deg