BELMANIP_00382


Location

lon / lat [deg]: 93.2232 / 41.2189

Source network: BELMANIP


Geostationary surface albedo (GSA) data


“+000”


“+057/+063”


Landcover information (based on ESA CCI landcover data)


Landcover fractions @ 2km distance


Landcover fractions @ 20 km distance


Legend


Distance to open water bodies [km]:

28.53

Distance to urban areas [km]:

none in region


Radius: 1 km

Number of landcover classes:

1

Dominant landcover type:

200: bare areas

Fraction of dominant landcover type [%]:

100.0


Radius: 2 km

Number of landcover classes:

1

Dominant landcover type:

200: bare areas

Fraction of dominant landcover type [%]:

100.0


Radius: 5 km

Number of landcover classes:

1

Dominant landcover type:

200: bare areas

Fraction of dominant landcover type [%]:

100.0


Radius: 10 km

Number of landcover classes:

1

Dominant landcover type:

200: bare areas

Fraction of dominant landcover type [%]:

100.0


Radius: 20 km

Number of landcover classes:

1

Dominant landcover type:

200: bare areas

Fraction of dominant landcover type [%]:

100.0


Disturbances


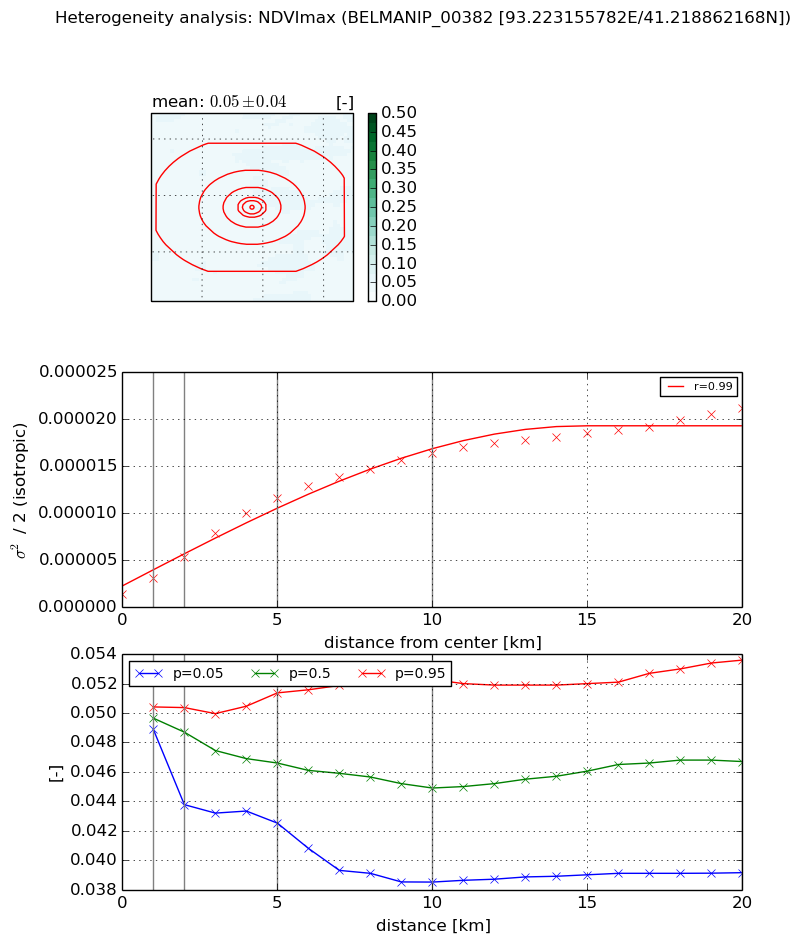
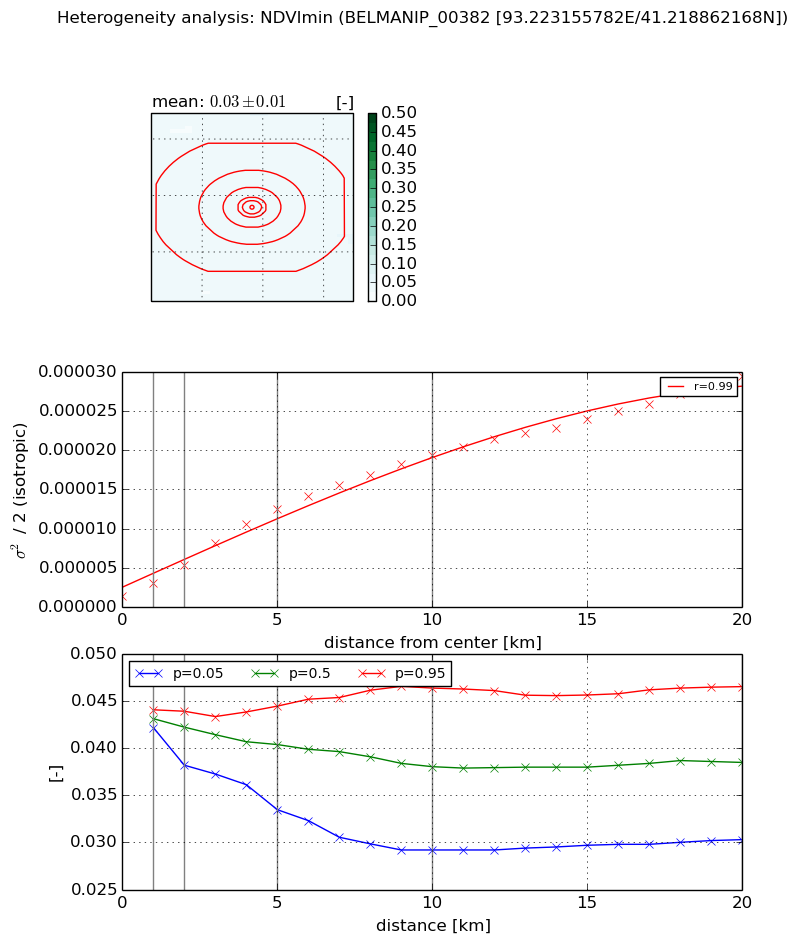
Heterogeneity analysis

The heterogeneity analysis provides information about the spatial and temporal heterogeneity of the site.

Topography


Roman et al. (2009) index


St

1.81073042978

Rcv

0.656789126027

Rse

0.0

Rst

-8.35998904649e-07

Rsv

-1.0


Height range @ 1km [m]

68

Height range @ 2km [m]

93

Height range @ 5km [m]

188

Height range @ 10km [m]

-999

Height range @ 20km [m]

-999


Variance slope @ 1 km

246

Variance slope @ 2 km

401

Variance slope @ 5 km

740

Variance slope @ 10 km

-999

Variance slope @ 20 km

-999


NDVI (max. NDVI composite)


Roman et al. (2009) index


St

2.03336103142

Rcv

0.230911711295

Rse

0.0

Rst

-0.244527248685

Rsv

-0.999950778309


NDVI range @ 1km [-]

0.0

NDVI range @ 2km [-]

0.01

NDVI range @ 5km [-]

0.01

NDVI range @ 10km [-]

0.01

NDVI range @ 20km [-]

0.01


Variance slope @ 1 km

1.67609280839e-06

Variance slope @ 2 km

1.94497435128e-06

Variance slope @ 5 km

2.12170185839e-06

Variance slope @ 10 km

1.52701805142e-06

Variance slope @ 20 km

8.78084562795e-07


NDVI (min. NDVI composite)I


Roman et al. (2009) index


St

2.00016059776

Rcv

0.568150264898

Rse

0.0

Rst

-1.17011814051e-07

Rsv

-0.931729179444


NDVI range @ 1km [-]

0.0

NDVI range @ 2km [-]

0.01

NDVI range @ 5km [-]

0.01

NDVI range @ 10km [-]

0.02

NDVI range @ 20km [-]

0.02


NDVI slope @ 1 km

1.64988962079e-06

NDVI slope @ 2 km

1.9672930496e-06

NDVI slope @ 5 km

2.30660552645e-06

NDVI slope @ 10 km

1.85194570807e-06

NDVI slope @ 20 km

1.32415754415e-06


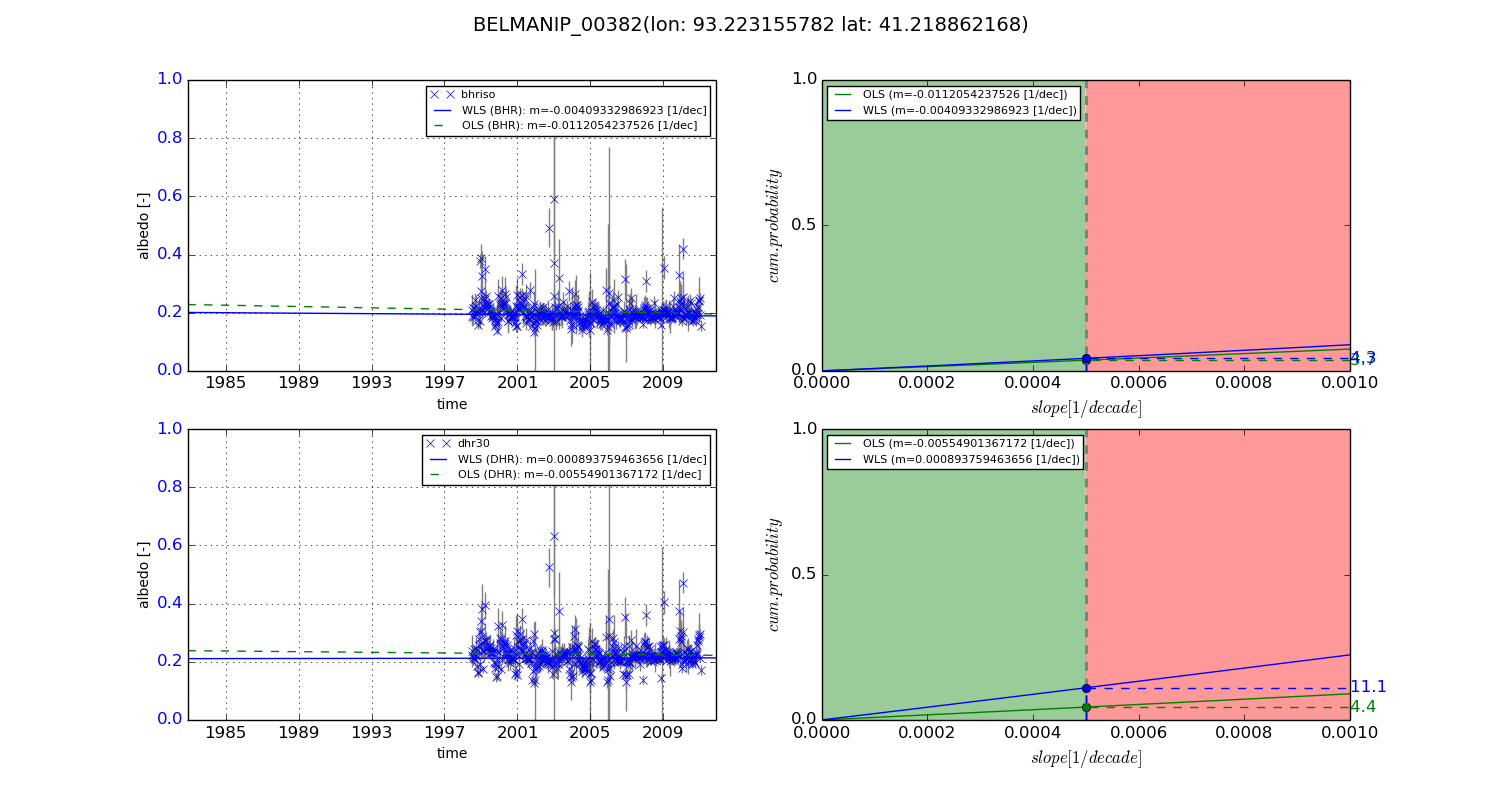
Temporal stability analysis

+000 deg (BHR)


BHR statistics

Temporal stability [1/decade]:


abs

rel


Weighted least square:

None


Ordinary least square:

None


Probabilities that GCOS criteria is met:

Weighted least square:

None %

Ordinary least square:

None %


DHR statistics

Temporal stability [1/decade]:


abs

rel


Weighted least square:

None


Ordinary least square:

None


Probabilities that GCOS criteria is met:

Weighted least square:

None %

Ordinary least square:

None %


+057/+063 deg (BHR)


BHR statistics

Temporal stability [1/decade]:


abs

rel


Weighted least square:

-0.00409332986923


Ordinary least square:

-0.0112054237526


Probabilities that GCOS criteria is met:

Weighted least square:

4.3 %

Ordinary least square:

3.7 %


DHR statistics

Temporal stability [1/decade]:


abs

rel


Weighted least square:

0.000893759463656


Ordinary least square:

-0.00554901367172


Probabilities that GCOS criteria is met:

Weighted least square:

11.1 %

Ordinary least square:

4.4 %


Temporal anomaly analyis

The variance of the temporal anomalies provides an additional measure about the stability of the signal AFTER removal of the mean seasonal cylce.

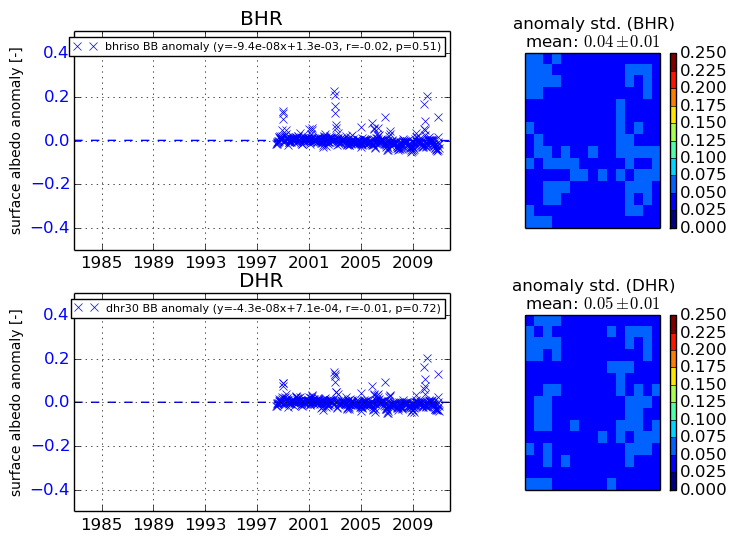
+000 deg


+057/+063 deg