BELMANIP_00422


Location

lon / lat [deg]: 0.8795 / 25.3348

Source network: BELMANIP


Geostationary surface albedo (GSA) data


“+000”


“+057/+063”


Landcover information (based on ESA CCI landcover data)


Landcover fractions @ 2km distance


Landcover fractions @ 20 km distance


Legend


Distance to open water bodies [km]:

none in region

Distance to urban areas [km]:

none in region


Radius: 1 km

Number of landcover classes:

1

Dominant landcover type:

200: bare areas

Fraction of dominant landcover type [%]:

100.0


Radius: 2 km

Number of landcover classes:

1

Dominant landcover type:

200: bare areas

Fraction of dominant landcover type [%]:

100.0


Radius: 5 km

Number of landcover classes:

1

Dominant landcover type:

200: bare areas

Fraction of dominant landcover type [%]:

100.0


Radius: 10 km

Number of landcover classes:

1

Dominant landcover type:

200: bare areas

Fraction of dominant landcover type [%]:

100.0


Radius: 20 km

Number of landcover classes:

1

Dominant landcover type:

200: bare areas

Fraction of dominant landcover type [%]:

100.0


Disturbances


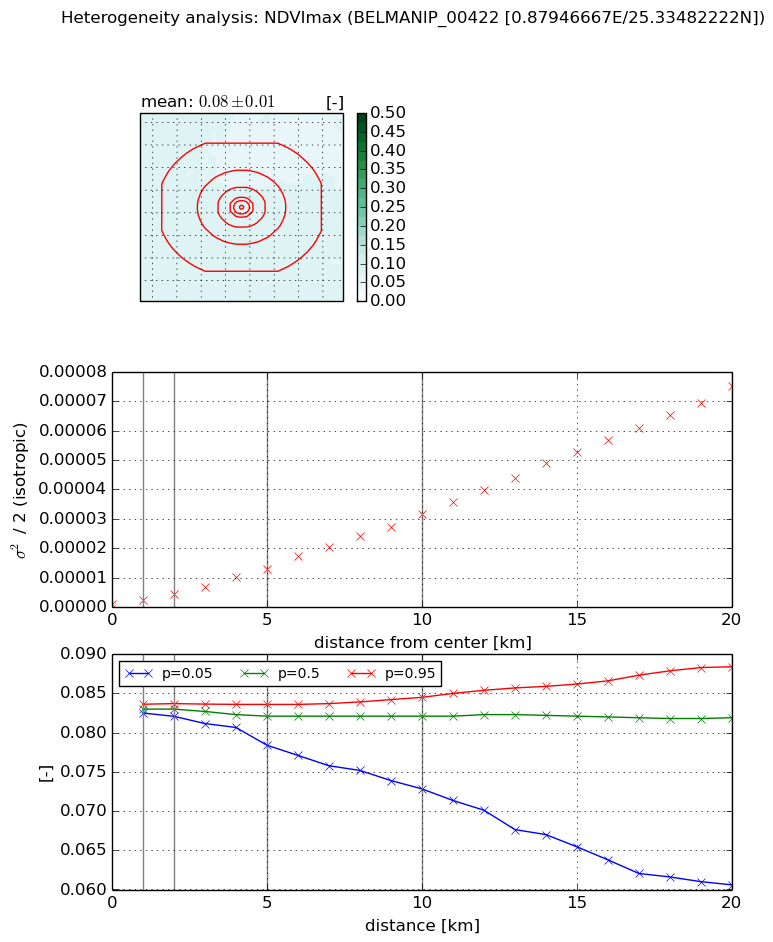
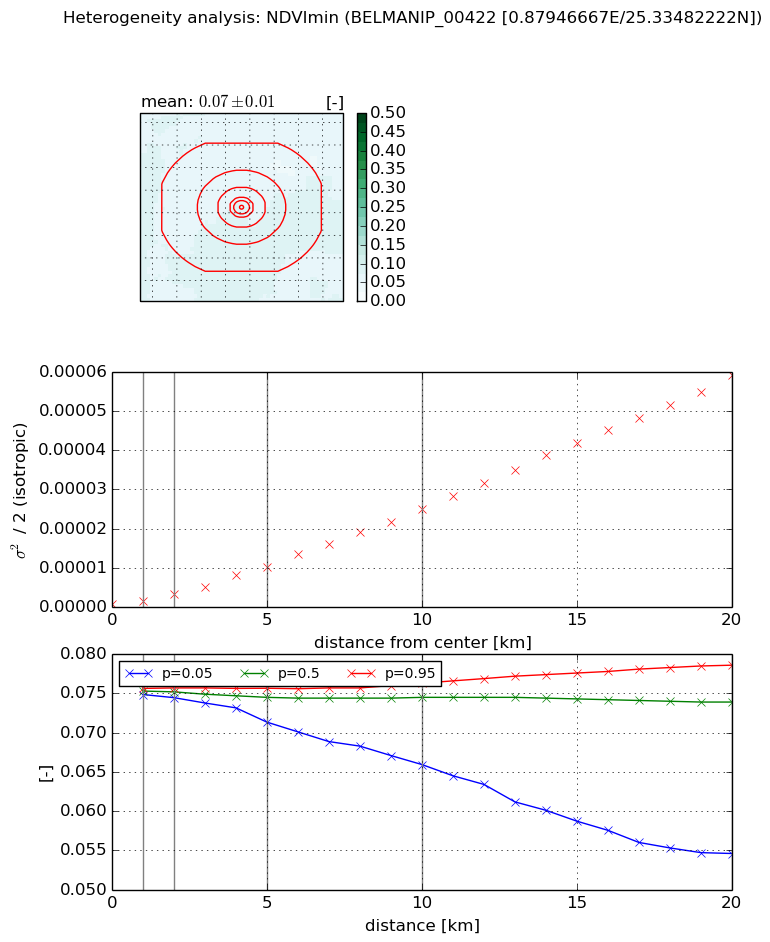
Heterogeneity analysis

The heterogeneity analysis provides information about the spatial and temporal heterogeneity of the site.

Topography


Roman et al. (2009) index


St

2.04333869318e-07

Rcv

1.1815580164

Rse

0.0

Rst

-0.0563143521514

Rsv

14681852.5831


Height range @ 1km [m]

4

Height range @ 2km [m]

5

Height range @ 5km [m]

16

Height range @ 10km [m]

-999

Height range @ 20km [m]

-999


Variance slope @ 1 km

9

Variance slope @ 2 km

9

Variance slope @ 5 km

5

Variance slope @ 10 km

-999

Variance slope @ 20 km

-999


NDVI (max. NDVI composite)


Roman et al. (2009) index


St

1.41677847974

Rcv

1.13271849383

Rse

0.0

Rst

-1.57209133798e-06

Rsv

-0.984759866832


NDVI range @ 1km [-]

0.0

NDVI range @ 2km [-]

0.0

NDVI range @ 5km [-]

0.01

NDVI range @ 10km [-]

0.01

NDVI range @ 20km [-]

0.03


Variance slope @ 1 km

1.13968385444e-06

Variance slope @ 2 km

1.73652846698e-06

Variance slope @ 5 km

2.46929985517e-06

Variance slope @ 10 km

3.14376269258e-06

Variance slope @ 20 km

3.79430016815e-06


NDVI (min. NDVI composite)I


Roman et al. (2009) index


St

1.56447567663

Rcv

1.14886531428

Rse

0.0

Rst

-9.61135524193e-07

Rsv

-0.768709078944


NDVI range @ 1km [-]

0.0

NDVI range @ 2km [-]

0.0

NDVI range @ 5km [-]

0.0

NDVI range @ 10km [-]

0.01

NDVI range @ 20km [-]

0.02


NDVI slope @ 1 km

8.62201434037e-07

NDVI slope @ 2 km

1.32546489689e-06

NDVI slope @ 5 km

1.95444983554e-06

NDVI slope @ 10 km

2.50665500768e-06

NDVI slope @ 20 km

3.01053965413e-06


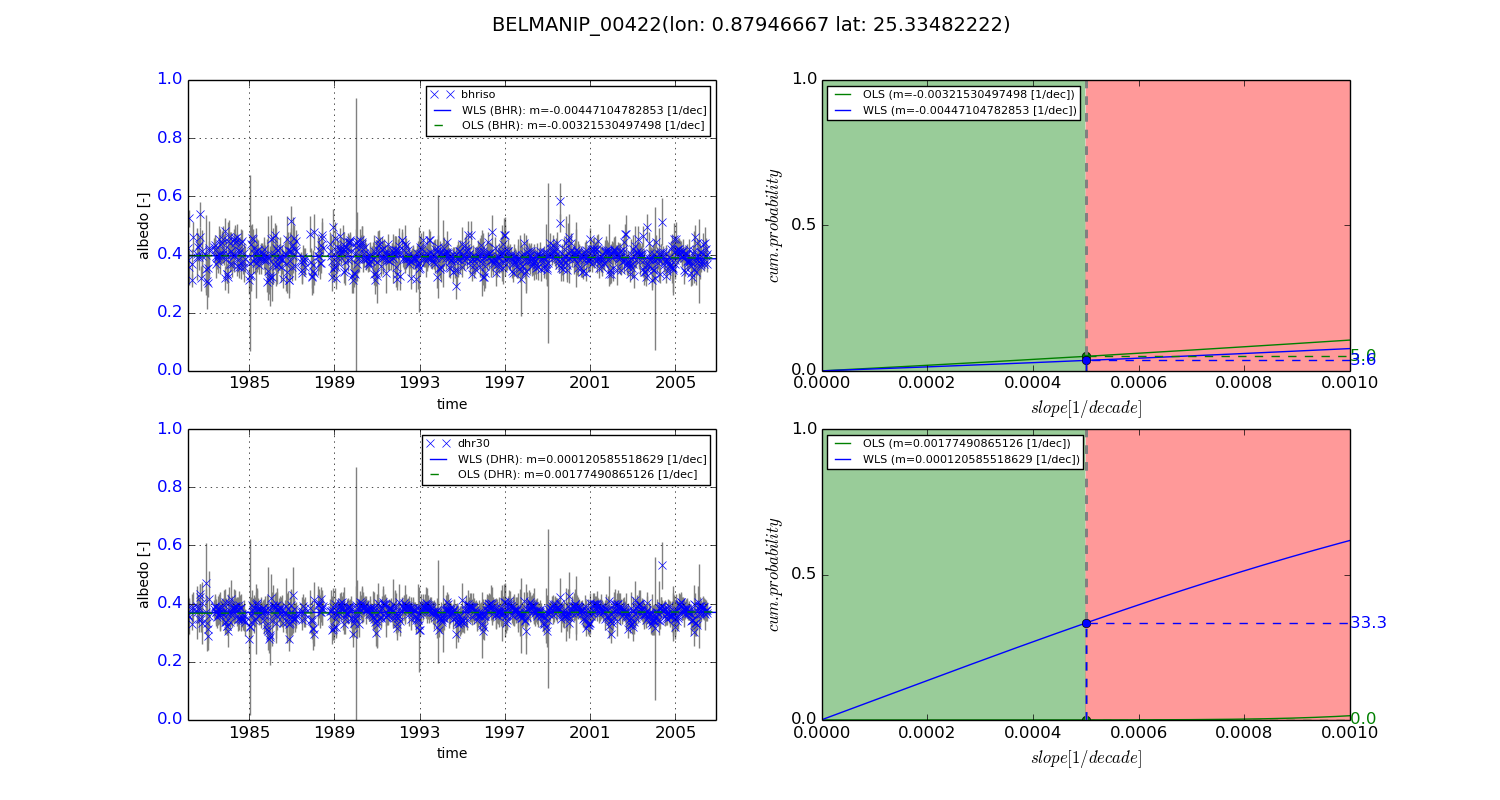
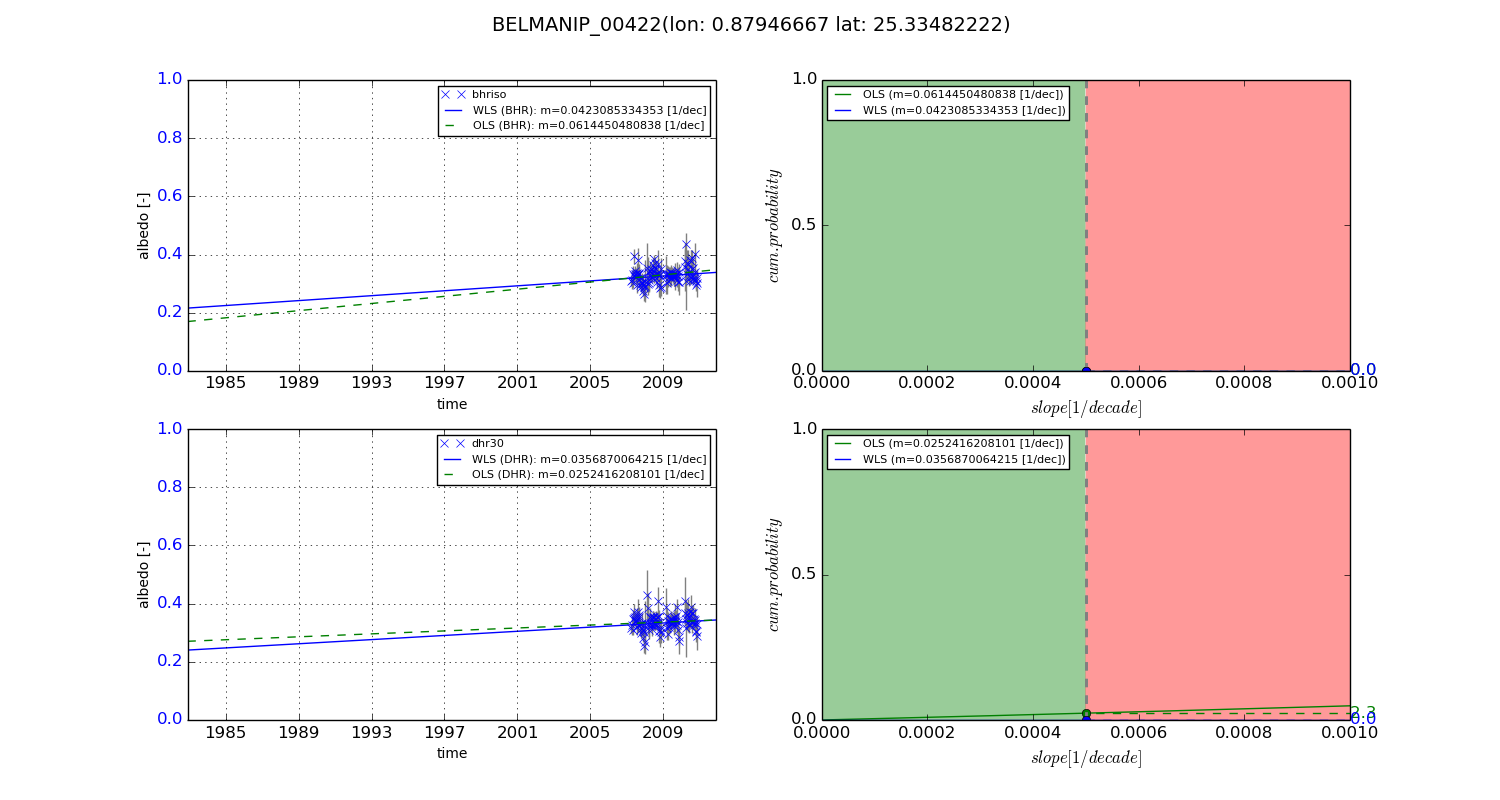
Temporal stability analysis

+000 deg (BHR)


BHR statistics

Temporal stability [1/decade]:


abs

rel


Weighted least square:

-0.00447104782853


Ordinary least square:

-0.00321530497498


Probabilities that GCOS criteria is met:

Weighted least square:

3.6 %

Ordinary least square:

5.0 %


DHR statistics

Temporal stability [1/decade]:


abs

rel


Weighted least square:

0.000120585518629


Ordinary least square:

0.00177490865126


Probabilities that GCOS criteria is met:

Weighted least square:

33.3 %

Ordinary least square:

0.0 %


+057/+063 deg (BHR)


BHR statistics

Temporal stability [1/decade]:


abs

rel


Weighted least square:

0.0423085334353


Ordinary least square:

0.0614450480838


Probabilities that GCOS criteria is met:

Weighted least square:

0.0 %

Ordinary least square:

0.0 %


DHR statistics

Temporal stability [1/decade]:


abs

rel


Weighted least square:

0.0356870064215


Ordinary least square:

0.0252416208101


Probabilities that GCOS criteria is met:

Weighted least square:

0.0 %

Ordinary least square:

2.3 %


Temporal anomaly analyis

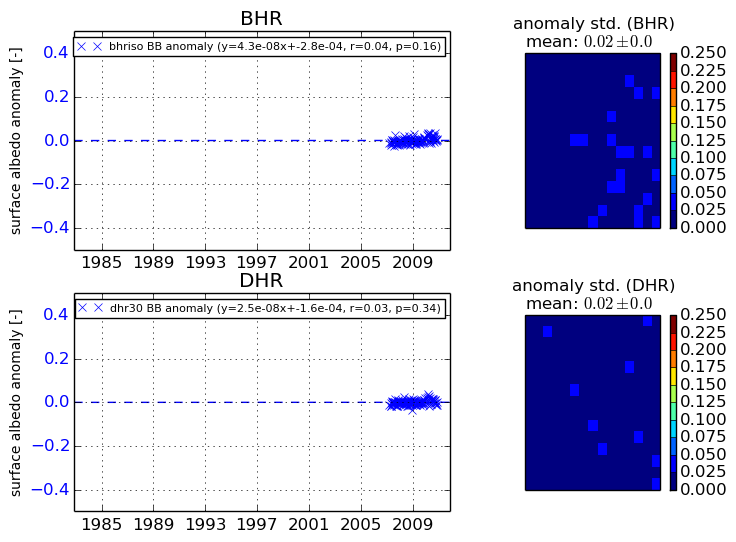
The variance of the temporal anomalies provides an additional measure about the stability of the signal AFTER removal of the mean seasonal cylce.
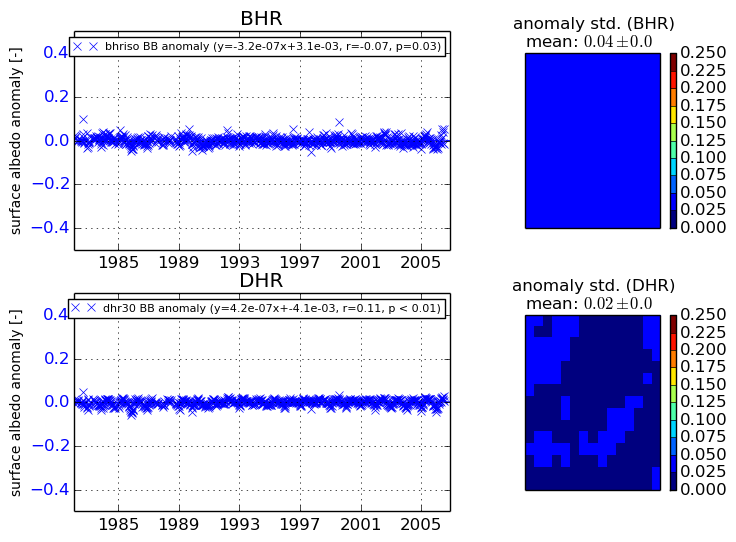
+000 deg


+057/+063 deg