BELMANIP_00427


Location

lon / lat [deg]: 8.9152 / 30.6027

Source network: BELMANIP


Geostationary surface albedo (GSA) data


“+000”


“+057/+063”


Landcover information (based on ESA CCI landcover data)


Landcover fractions @ 2km distance


Landcover fractions @ 20 km distance


Legend


Distance to open water bodies [km]:

none in region

Distance to urban areas [km]:

none in region


Radius: 1 km

Number of landcover classes:

1

Dominant landcover type:

200: bare areas

Fraction of dominant landcover type [%]:

100.0


Radius: 2 km

Number of landcover classes:

1

Dominant landcover type:

200: bare areas

Fraction of dominant landcover type [%]:

100.0


Radius: 5 km

Number of landcover classes:

1

Dominant landcover type:

200: bare areas

Fraction of dominant landcover type [%]:

100.0


Radius: 10 km

Number of landcover classes:

1

Dominant landcover type:

200: bare areas

Fraction of dominant landcover type [%]:

100.0


Radius: 20 km

Number of landcover classes:

1

Dominant landcover type:

200: bare areas

Fraction of dominant landcover type [%]:

100.0


Disturbances


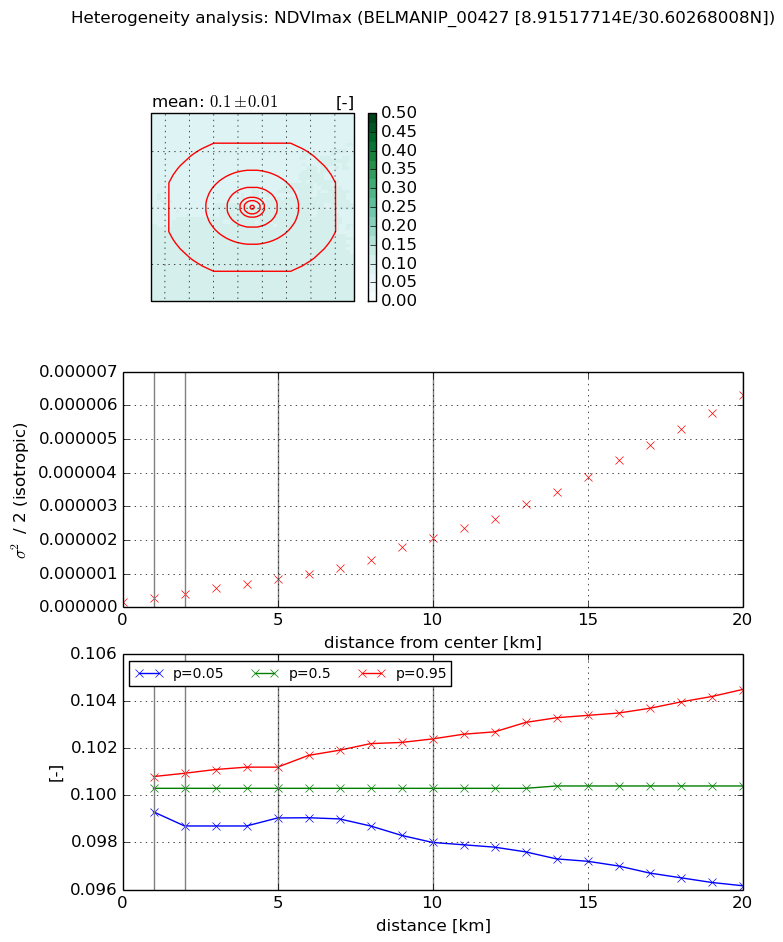
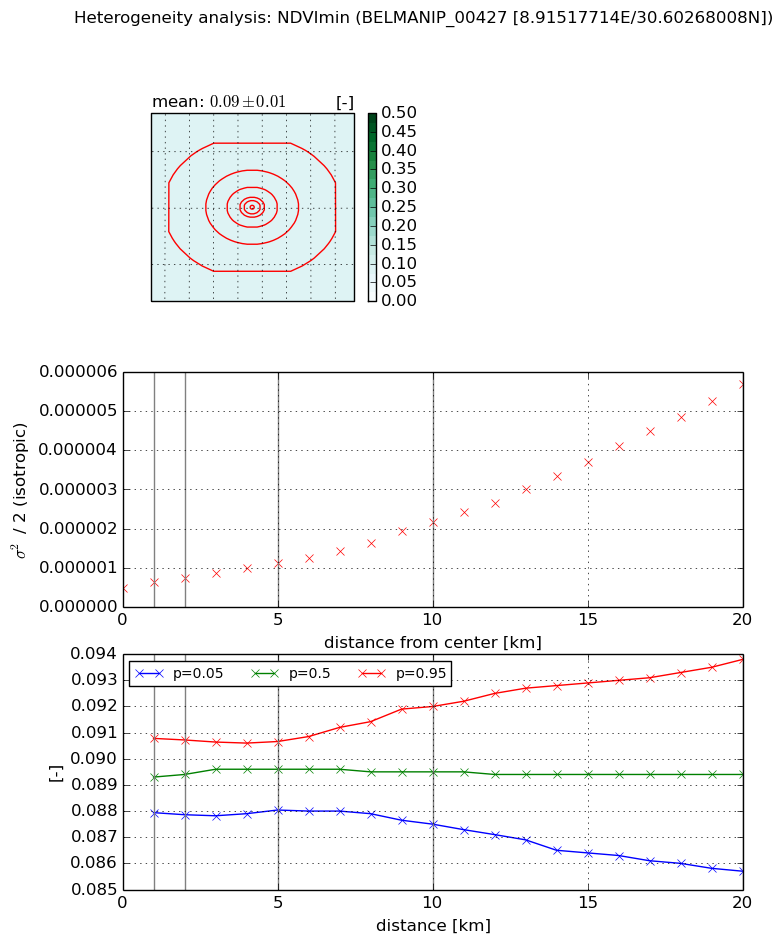
Heterogeneity analysis

The heterogeneity analysis provides information about the spatial and temporal heterogeneity of the site.

Topography


Roman et al. (2009) index


St

11.8647541314

Rcv

0.0413784876475

Rse

0.0

Rst

-0.0197536458323

Rsv

0.191717606749


Height range @ 1km [m]

93

Height range @ 2km [m]

95

Height range @ 5km [m]

99

Height range @ 10km [m]

-999

Height range @ 20km [m]

-999


Variance slope @ 1 km

1210

Variance slope @ 2 km

336

Variance slope @ 5 km

64

Variance slope @ 10 km

-999

Variance slope @ 20 km

-999


NDVI (max. NDVI composite)


Roman et al. (2009) index


St

3.02412481994

Rcv

-0.130660319014

Rse

0.0

Rst

-0.260497243238

Rsv

0.600864982656


NDVI range @ 1km [-]

0.0

NDVI range @ 2km [-]

0.0

NDVI range @ 5km [-]

0.0

NDVI range @ 10km [-]

0.0

NDVI range @ 20km [-]

0.01


Variance slope @ 1 km

1.22122808942e-07

Variance slope @ 2 km

1.2685983339e-07

Variance slope @ 5 km

1.3659868784e-07

Variance slope @ 10 km

1.8329275862e-07

Variance slope @ 20 km

3.06514726784e-07


NDVI (min. NDVI composite)I


Roman et al. (2009) index


St

nan

Rcv

nan

Rse

nan

Rst

nan

Rsv

nan


NDVI range @ 1km [-]

0.0

NDVI range @ 2km [-]

0.0

NDVI range @ 5km [-]

0.0

NDVI range @ 10km [-]

0.0

NDVI range @ 20km [-]

0.01


NDVI slope @ 1 km

1.51719971677e-07

NDVI slope @ 2 km

1.29727665203e-07

NDVI slope @ 5 km

1.24669846788e-07

NDVI slope @ 10 km

1.59710062062e-07

NDVI slope @ 20 km

2.58547038507e-07


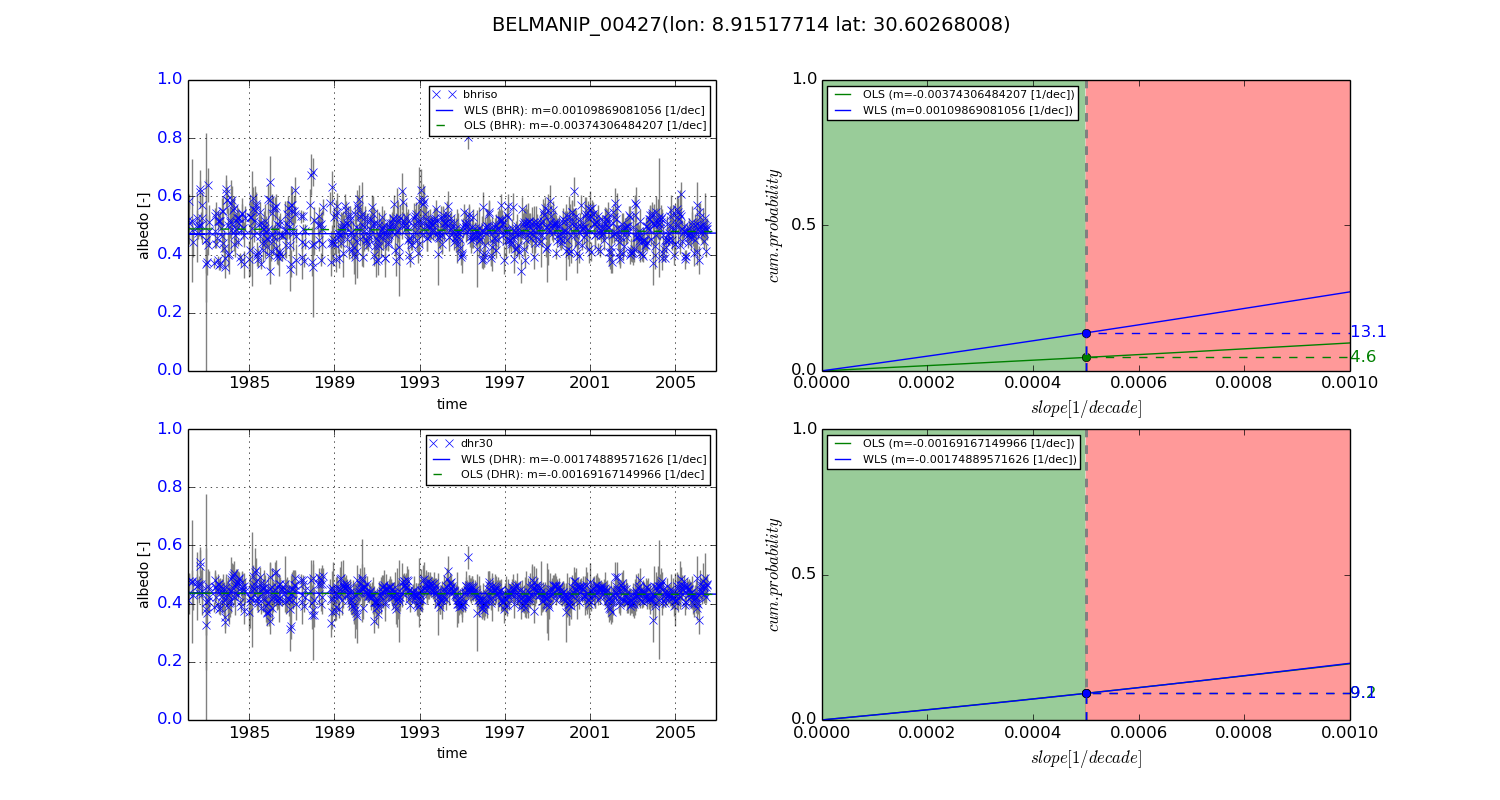
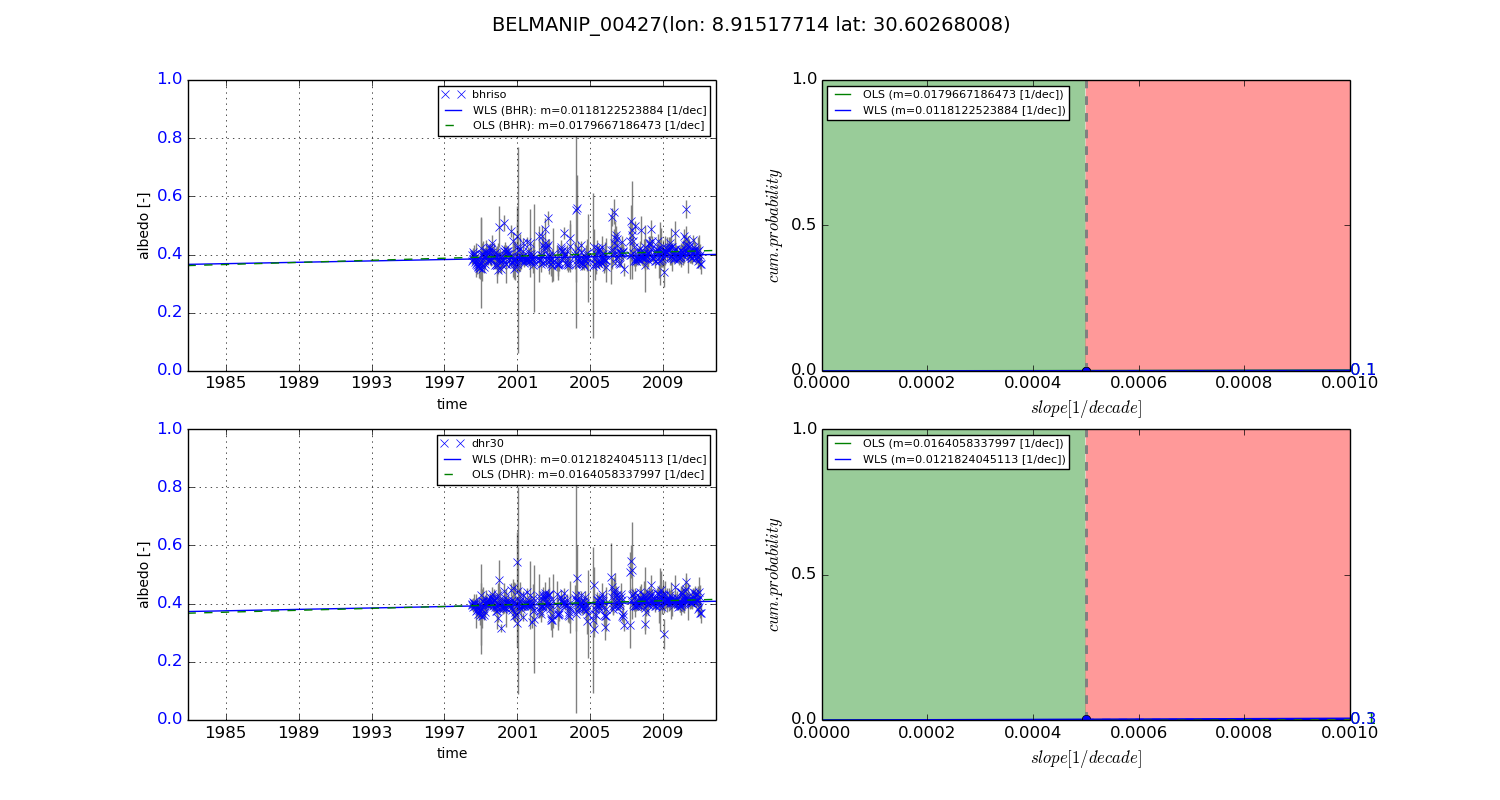
Temporal stability analysis

+000 deg (BHR)


BHR statistics

Temporal stability [1/decade]:


abs

rel


Weighted least square:

0.00109869081056


Ordinary least square:

-0.00374306484207


Probabilities that GCOS criteria is met:

Weighted least square:

13.1 %

Ordinary least square:

4.6 %


DHR statistics

Temporal stability [1/decade]:


abs

rel


Weighted least square:

-0.00174889571626


Ordinary least square:

-0.00169167149966


Probabilities that GCOS criteria is met:

Weighted least square:

9.1 %

Ordinary least square:

9.2 %


+057/+063 deg (BHR)


BHR statistics

Temporal stability [1/decade]:


abs

rel


Weighted least square:

0.0118122523884


Ordinary least square:

0.0179667186473


Probabilities that GCOS criteria is met:

Weighted least square:

0.1 %

Ordinary least square:

0.1 %


DHR statistics

Temporal stability [1/decade]:


abs

rel


Weighted least square:

0.0121824045113


Ordinary least square:

0.0164058337997


Probabilities that GCOS criteria is met:

Weighted least square:

0.3 %

Ordinary least square:

0.1 %


Temporal anomaly analyis

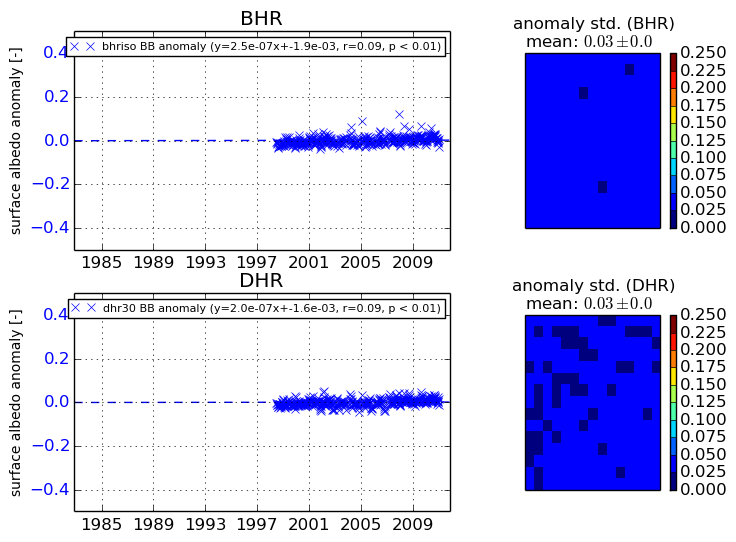
The variance of the temporal anomalies provides an additional measure about the stability of the signal AFTER removal of the mean seasonal cylce.
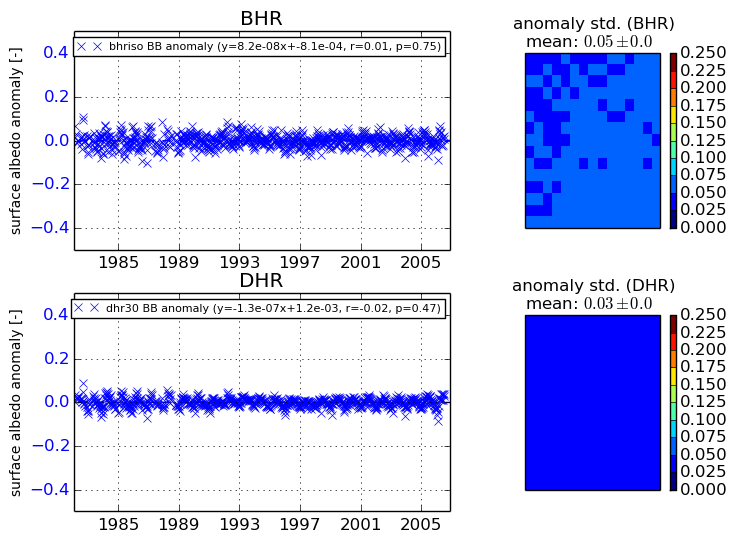
+000 deg


+057/+063 deg