BELMANIP_00428


Location

lon / lat [deg]: 106.7902 / 41.7902

Source network: BELMANIP


Geostationary surface albedo (GSA) data


“+000”


“+057/+063”


Landcover information (based on ESA CCI landcover data)


Landcover fractions @ 2km distance


Landcover fractions @ 20 km distance


Legend


Distance to open water bodies [km]:

none in region

Distance to urban areas [km]:

43.02


Radius: 1 km

Number of landcover classes:

1

Dominant landcover type:

200: bare areas

Fraction of dominant landcover type [%]:

100.0


Radius: 2 km

Number of landcover classes:

1

Dominant landcover type:

200: bare areas

Fraction of dominant landcover type [%]:

100.0


Radius: 5 km

Number of landcover classes:

1

Dominant landcover type:

200: bare areas

Fraction of dominant landcover type [%]:

100.0


Radius: 10 km

Number of landcover classes:

1

Dominant landcover type:

200: bare areas

Fraction of dominant landcover type [%]:

100.0


Radius: 20 km

Number of landcover classes:

1

Dominant landcover type:

200: bare areas

Fraction of dominant landcover type [%]:

100.0


Disturbances


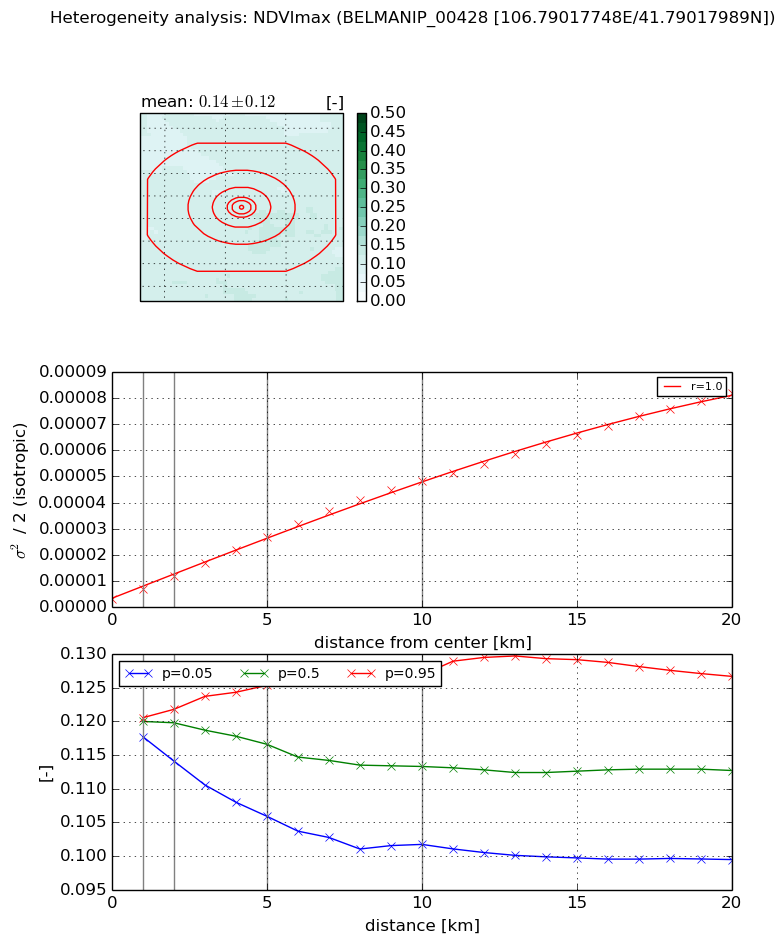
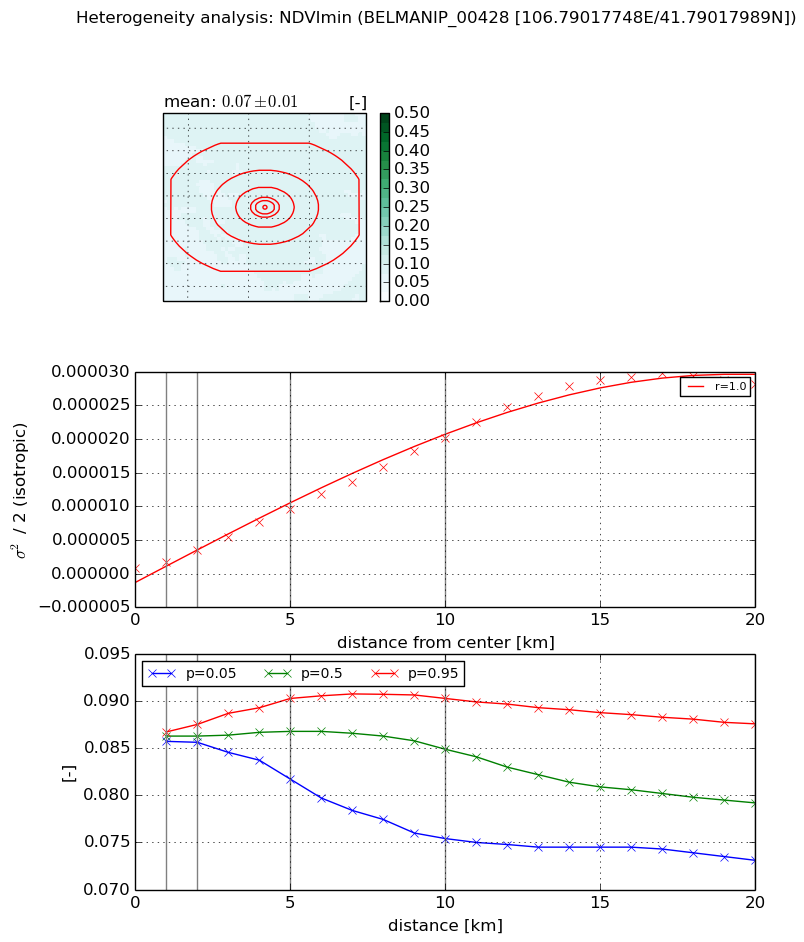
Heterogeneity analysis

The heterogeneity analysis provides information about the spatial and temporal heterogeneity of the site.

Topography


Roman et al. (2009) index


St

1.12061509715

Rcv

0.413602402941

Rse

0.0

Rst

1.59708581334e-06

Rsv

2.26349718094


Height range @ 1km [m]

36

Height range @ 2km [m]

52

Height range @ 5km [m]

95

Height range @ 10km [m]

-999

Height range @ 20km [m]

-999


Variance slope @ 1 km

138

Variance slope @ 2 km

159

Variance slope @ 5 km

184

Variance slope @ 10 km

-999

Variance slope @ 20 km

-999


NDVI (max. NDVI composite)


Roman et al. (2009) index


St

1.61524823165

Rcv

0.456410771446

Rse

0.0

Rst

1.88857593755e-09

Rsv

1.40088889195


NDVI range @ 1km [-]

0.0

NDVI range @ 2km [-]

0.01

NDVI range @ 5km [-]

0.02

NDVI range @ 10km [-]

0.03

NDVI range @ 20km [-]

0.03


Variance slope @ 1 km

3.69370176162e-06

Variance slope @ 2 km

4.40558207825e-06

Variance slope @ 5 km

4.8155198832e-06

Variance slope @ 10 km

4.6653335284e-06

Variance slope @ 20 km

3.94675213235e-06


NDVI (min. NDVI composite)I


Roman et al. (2009) index


St

1.9413107087

Rcv

1.10141552289

Rse

0.0

Rst

-1.01777255914e-08

Rsv

-0.44393214701


NDVI range @ 1km [-]

0.0

NDVI range @ 2km [-]

0.0

NDVI range @ 5km [-]

0.01

NDVI range @ 10km [-]

0.01

NDVI range @ 20km [-]

0.01


NDVI slope @ 1 km

1.00528941344e-06

NDVI slope @ 2 km

1.34235497296e-06

NDVI slope @ 5 km

1.82271850614e-06

NDVI slope @ 10 km

2.01026519023e-06

NDVI slope @ 20 km

1.61812653486e-06


Temporal stability analysis

+000 deg (BHR)


BHR statistics

Temporal stability [1/decade]:


abs

rel


Weighted least square:

None


Ordinary least square:

None


Probabilities that GCOS criteria is met:

Weighted least square:

None %

Ordinary least square:

None %


DHR statistics

Temporal stability [1/decade]:


abs

rel


Weighted least square:

None


Ordinary least square:

None


Probabilities that GCOS criteria is met:

Weighted least square:

None %

Ordinary least square:

None %


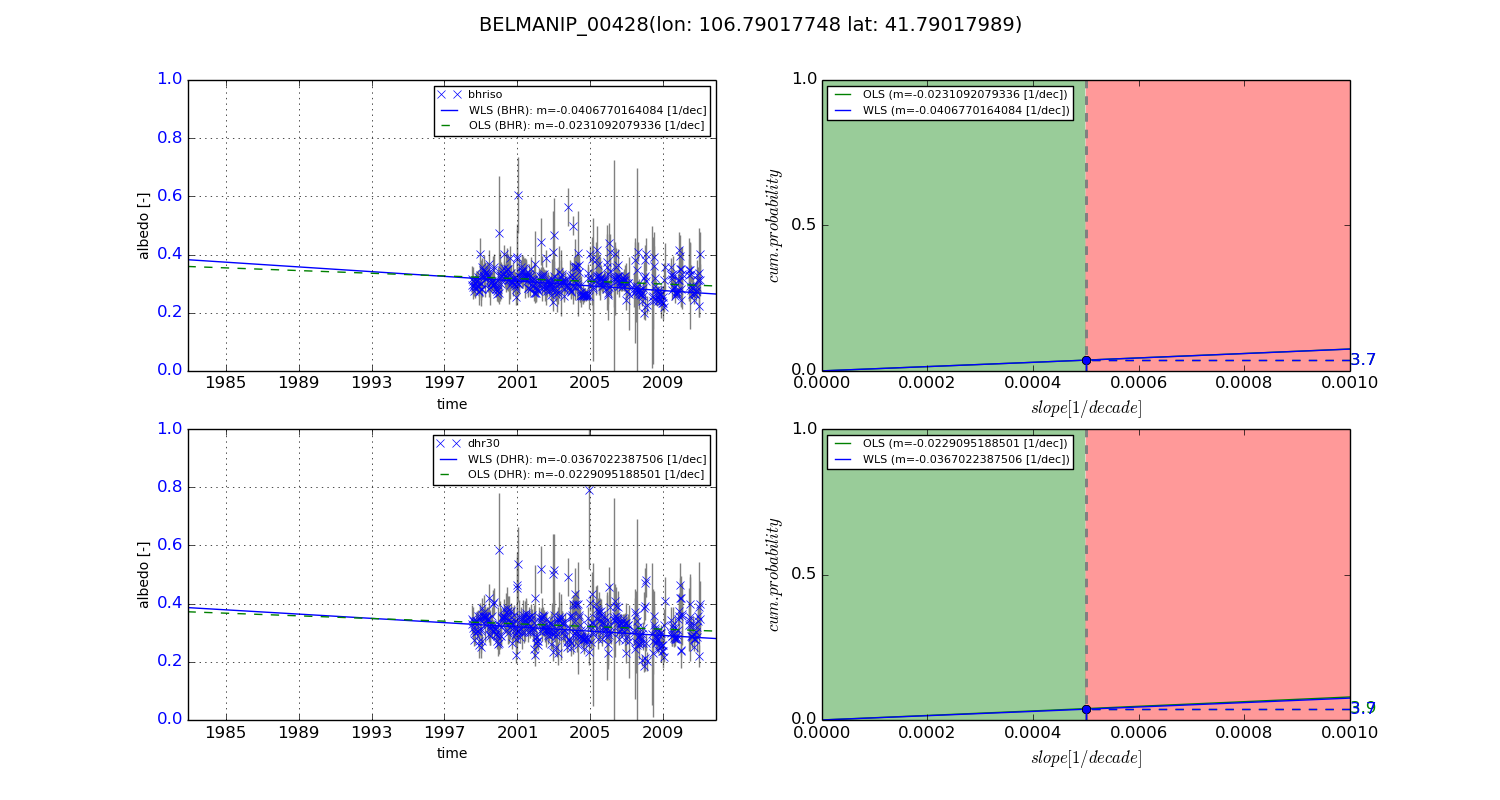
+057/+063 deg (BHR)


BHR statistics

Temporal stability [1/decade]:


abs

rel


Weighted least square:

-0.0406770164084


Ordinary least square:

-0.0231092079336


Probabilities that GCOS criteria is met:

Weighted least square:

3.7 %

Ordinary least square:

3.7 %


DHR statistics

Temporal stability [1/decade]:


abs

rel


Weighted least square:

-0.0367022387506


Ordinary least square:

-0.0229095188501


Probabilities that GCOS criteria is met:

Weighted least square:

3.7 %

Ordinary least square:

3.9 %


Temporal anomaly analyis

The variance of the temporal anomalies provides an additional measure about the stability of the signal AFTER removal of the mean seasonal cylce.

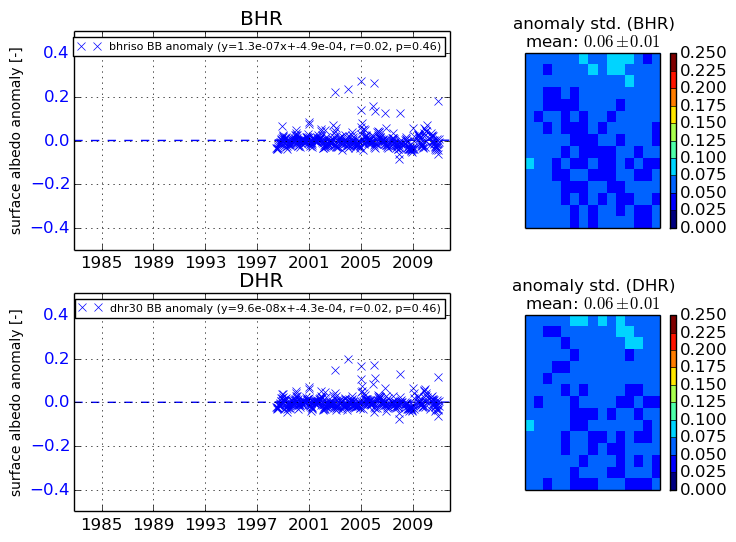
+000 deg


+057/+063 deg