BRATTS_LAKE


Location

lon / lat [deg]: -104.7 / 50.28

Source network: AERONET


Geostationary surface albedo (GSA) data


“+000”


“+057/+063”


Landcover information (based on ESA CCI landcover data)


Landcover fractions @ 2km distance


Landcover fractions @ 20 km distance


Legend


Distance to open water bodies [km]:

17.63

Distance to urban areas [km]:

13.8


Radius: 1 km

Number of landcover classes:

2

Dominant landcover type:

10: cropland, rainfed

Fraction of dominant landcover type [%]:

96.0


Radius: 2 km

Number of landcover classes:

2

Dominant landcover type:

10: cropland, rainfed

Fraction of dominant landcover type [%]:

86.0


Radius: 5 km

Number of landcover classes:

2

Dominant landcover type:

10: cropland, rainfed

Fraction of dominant landcover type [%]:

84.0


Radius: 10 km

Number of landcover classes:

2

Dominant landcover type:

10: cropland, rainfed

Fraction of dominant landcover type [%]:

82.0


Radius: 20 km

Number of landcover classes:

3

Dominant landcover type:

10: cropland, rainfed

Fraction of dominant landcover type [%]:

77.0


Disturbances


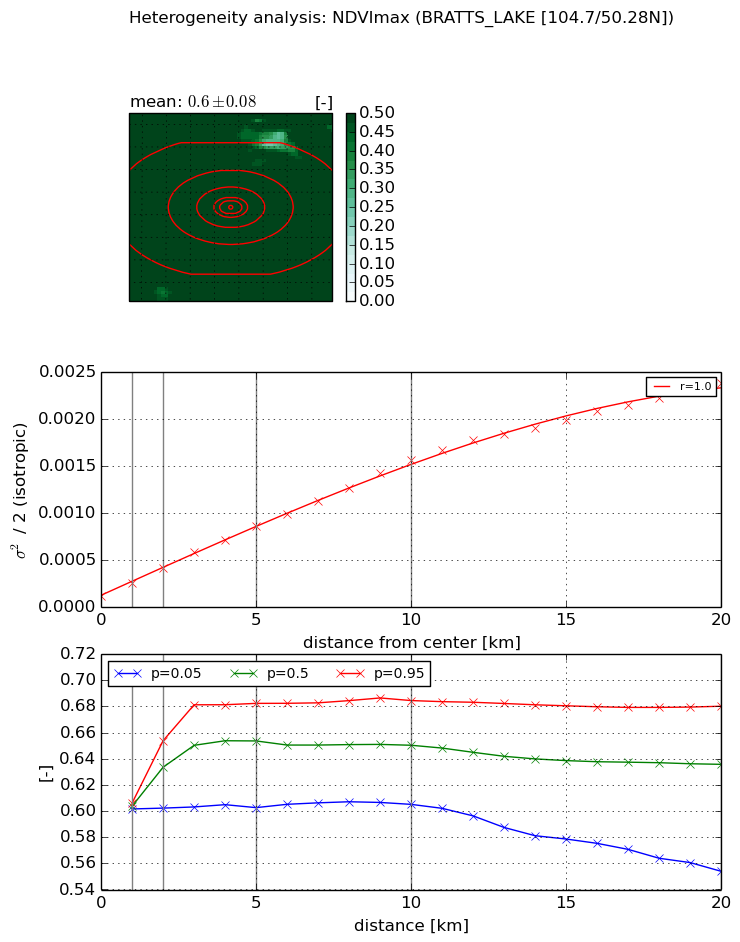
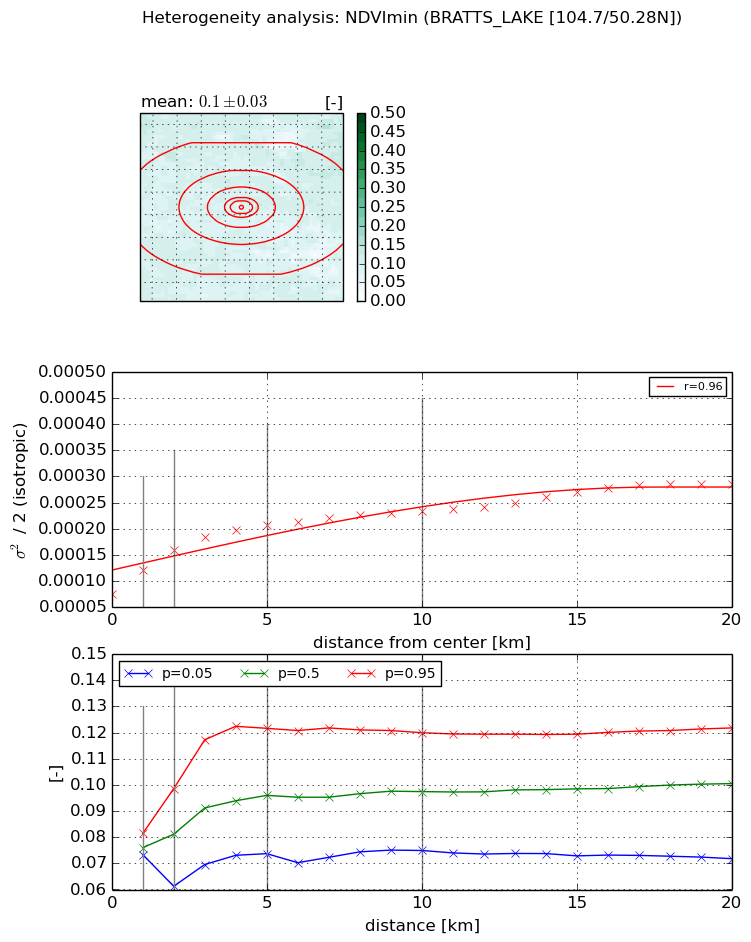
Heterogeneity analysis

The heterogeneity analysis provides information about the spatial and temporal heterogeneity of the site.

Topography


Roman et al. (2009) index


St

5.42586406002

Rcv

0.211531294436

Rse

0.0

Rst

0.00825709185416

Rsv

-0.333118941799


Height range @ 1km [m]

3

Height range @ 2km [m]

5

Height range @ 5km [m]

9

Height range @ 10km [m]

-999

Height range @ 20km [m]

-999


Variance slope @ 1 km

1

Variance slope @ 2 km

1

Variance slope @ 5 km

2

Variance slope @ 10 km

-999

Variance slope @ 20 km

-999


NDVI (max. NDVI composite)


Roman et al. (2009) index


St

2.11148679868

Rcv

0.0627147832923

Rse

0.0

Rst

-0.358085246196

Rsv

-0.999999760442


NDVI range @ 1km [-]

0.0

NDVI range @ 2km [-]

0.05

NDVI range @ 5km [-]

0.08

NDVI range @ 10km [-]

0.08

NDVI range @ 20km [-]

0.13


Variance slope @ 1 km

0.000131148034255

Variance slope @ 2 km

0.000146722210563

Variance slope @ 5 km

0.000148839692474

Variance slope @ 10 km

0.000143883058666

Variance slope @ 20 km

0.000113496121647


NDVI (min. NDVI composite)I


Roman et al. (2009) index


St

7.87286142981

Rcv

-0.120010893765

Rse

0.0

Rst

-0.0853752540811

Rsv

0.175669714339


NDVI range @ 1km [-]

0.01

NDVI range @ 2km [-]

0.04

NDVI range @ 5km [-]

0.05

NDVI range @ 10km [-]

0.05

NDVI range @ 20km [-]

0.05


NDVI slope @ 1 km

4.47600174599e-05

NDVI slope @ 2 km

4.13192246864e-05

NDVI slope @ 5 km

2.60363389428e-05

NDVI slope @ 10 km

1.37862700556e-05

NDVI slope @ 20 km

8.32205450829e-06


Temporal stability analysis

+000 deg (BHR)


BHR statistics

Temporal stability [1/decade]:


abs

rel


Weighted least square:

None


Ordinary least square:

None


Probabilities that GCOS criteria is met:

Weighted least square:

None %

Ordinary least square:

None %


DHR statistics

Temporal stability [1/decade]:


abs

rel


Weighted least square:

None


Ordinary least square:

None


Probabilities that GCOS criteria is met:

Weighted least square:

None %

Ordinary least square:

None %


+057/+063 deg (BHR)


BHR statistics

Temporal stability [1/decade]:


abs

rel


Weighted least square:

None


Ordinary least square:

None


Probabilities that GCOS criteria is met:

Weighted least square:

None %

Ordinary least square:

None %


DHR statistics

Temporal stability [1/decade]:


abs

rel


Weighted least square:

None


Ordinary least square:

None


Probabilities that GCOS criteria is met:

Weighted least square:

None %

Ordinary least square:

None %


Temporal anomaly analyis

The variance of the temporal anomalies provides an additional measure about the stability of the signal AFTER removal of the mean seasonal cylce.

+000 deg


+057/+063 deg