CALIPSO_ZION


Location

lon / lat [deg]: -76.199 / 39.9324

Source network: AERONET


Geostationary surface albedo (GSA) data


“+000”


“+057/+063”


Landcover information (based on ESA CCI landcover data)


Landcover fractions @ 2km distance


Landcover fractions @ 20 km distance


Legend


Distance to open water bodies [km]:

11.57

Distance to urban areas [km]:

4.21


Radius: 1 km

Number of landcover classes:

4

Dominant landcover type:

130: grassland

Fraction of dominant landcover type [%]:

84.0


Radius: 2 km

Number of landcover classes:

5

Dominant landcover type:

130: grassland

Fraction of dominant landcover type [%]:

61.0


Radius: 5 km

Number of landcover classes:

6

Dominant landcover type:

130: grassland

Fraction of dominant landcover type [%]:

65.0


Radius: 10 km

Number of landcover classes:

7

Dominant landcover type:

130: grassland

Fraction of dominant landcover type [%]:

57.0


Radius: 20 km

Number of landcover classes:

8

Dominant landcover type:

130: grassland

Fraction of dominant landcover type [%]:

49.0


Disturbances


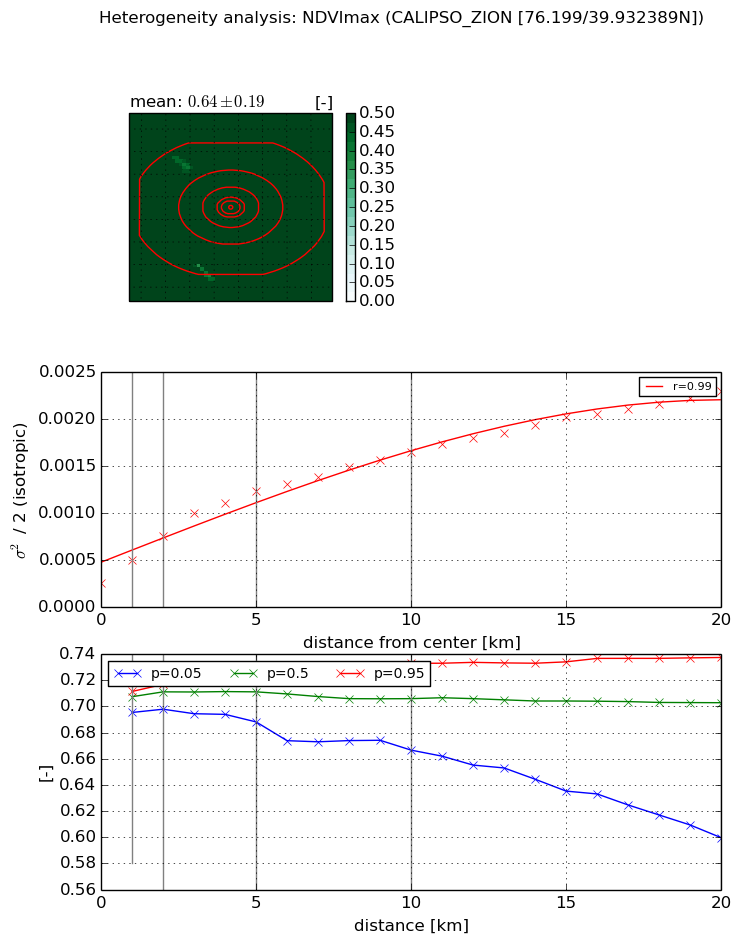
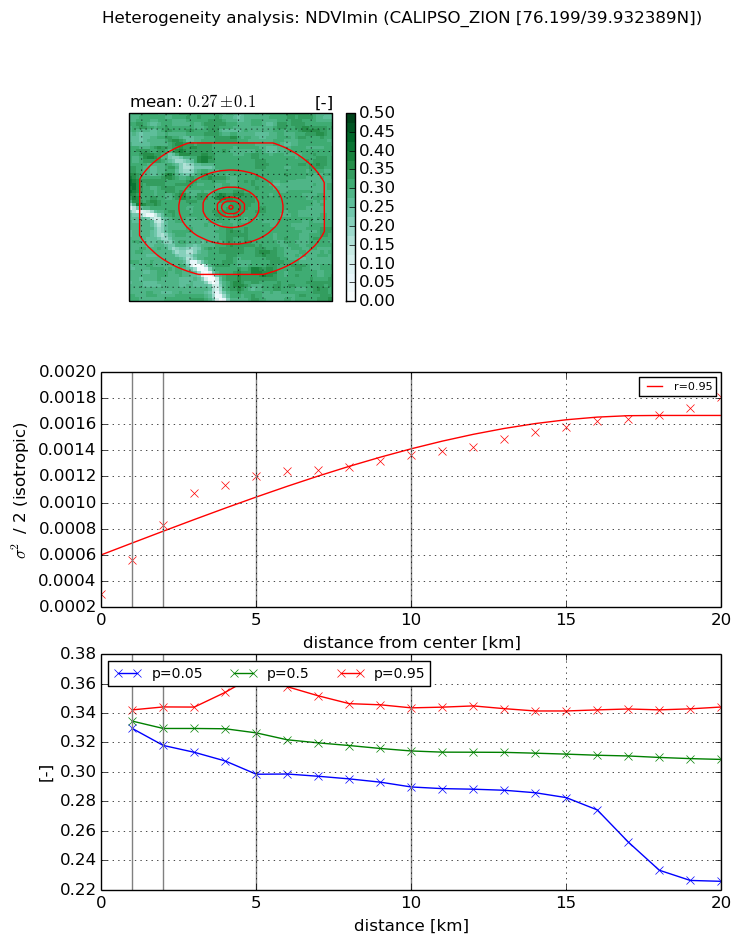
Heterogeneity analysis

The heterogeneity analysis provides information about the spatial and temporal heterogeneity of the site.

Topography


Roman et al. (2009) index


St

11.5336760268

Rcv

0.241298674929

Rse

0.0

Rst

0.0177378422869

Rsv

-0.00107136105499


Height range @ 1km [m]

43

Height range @ 2km [m]

83

Height range @ 5km [m]

123

Height range @ 10km [m]

-999

Height range @ 20km [m]

-999


Variance slope @ 1 km

384

Variance slope @ 2 km

366

Variance slope @ 5 km

374

Variance slope @ 10 km

-999

Variance slope @ 20 km

-999


NDVI (max. NDVI composite)


Roman et al. (2009) index


St

1.48744519616e-07

Rcv

0.528574898146

Rse

0.0

Rst

-0.0103393560215

Rsv

20168809.7658


NDVI range @ 1km [-]

0.02

NDVI range @ 2km [-]

0.02

NDVI range @ 5km [-]

0.04

NDVI range @ 10km [-]

0.07

NDVI range @ 20km [-]

0.14


Variance slope @ 1 km

0.000239104463292

Variance slope @ 2 km

0.00024511307611

Variance slope @ 5 km

0.0001986364466

Variance slope @ 10 km

0.000130604499643

Variance slope @ 20 km

8.99723376142e-05


NDVI (min. NDVI composite)I


Roman et al. (2009) index


St

0.941441511323

Rcv

1.19705591725

Rse

0.0

Rst

0.0547814018628

Rsv

1.93476531516


NDVI range @ 1km [-]

0.01

NDVI range @ 2km [-]

0.03

NDVI range @ 5km [-]

0.07

NDVI range @ 10km [-]

0.05

NDVI range @ 20km [-]

0.12


NDVI slope @ 1 km

0.00026599741731

NDVI slope @ 2 km

0.00026646098043

NDVI slope @ 5 km

0.000185116422692

NDVI slope @ 10 km

9.19962855895e-05

NDVI slope @ 20 km

5.61789076504e-05


Temporal stability analysis

+000 deg (BHR)


BHR statistics

Temporal stability [1/decade]:


abs

rel


Weighted least square:

-99999.0


Ordinary least square:

-99999.0


Probabilities that GCOS criteria is met:

Weighted least square:

-99999.0 %

Ordinary least square:

-99999.0 %


DHR statistics

Temporal stability [1/decade]:


abs

rel


Weighted least square:

-99999.0


Ordinary least square:

-99999.0


Probabilities that GCOS criteria is met:

Weighted least square:

-99999.0 %

Ordinary least square:

-99999.0 %


+057/+063 deg (BHR)


BHR statistics

Temporal stability [1/decade]:


abs

rel


Weighted least square:

None


Ordinary least square:

None


Probabilities that GCOS criteria is met:

Weighted least square:

None %

Ordinary least square:

None %


DHR statistics

Temporal stability [1/decade]:


abs

rel


Weighted least square:

None


Ordinary least square:

None


Probabilities that GCOS criteria is met:

Weighted least square:

None %

Ordinary least square:

None %


Temporal anomaly analyis

The variance of the temporal anomalies provides an additional measure about the stability of the signal AFTER removal of the mean seasonal cylce.

+000 deg


+057/+063 deg