CAMPO_GRANDE_SONDA


Location

lon / lat [deg]: -54.5381 / -20.4383

Source network: AERONET


Geostationary surface albedo (GSA) data


“+000”


“+057/+063”


Landcover information (based on ESA CCI landcover data)


Landcover fractions @ 2km distance


Landcover fractions @ 20 km distance


Legend


Distance to open water bodies [km]:

9.53

Distance to urban areas [km]:

0.11


Radius: 1 km

Number of landcover classes:

2

Dominant landcover type:

10: cropland, rainfed

Fraction of dominant landcover type [%]:

54.0


Radius: 2 km

Number of landcover classes:

2

Dominant landcover type:

10: cropland, rainfed

Fraction of dominant landcover type [%]:

64.0


Radius: 5 km

Number of landcover classes:

2

Dominant landcover type:

10: cropland, rainfed

Fraction of dominant landcover type [%]:

55.0


Radius: 10 km

Number of landcover classes:

3

Dominant landcover type:

10: cropland, rainfed

Fraction of dominant landcover type [%]:

60.0


Radius: 20 km

Number of landcover classes:

4

Dominant landcover type:

10: cropland, rainfed

Fraction of dominant landcover type [%]:

73.0


Disturbances


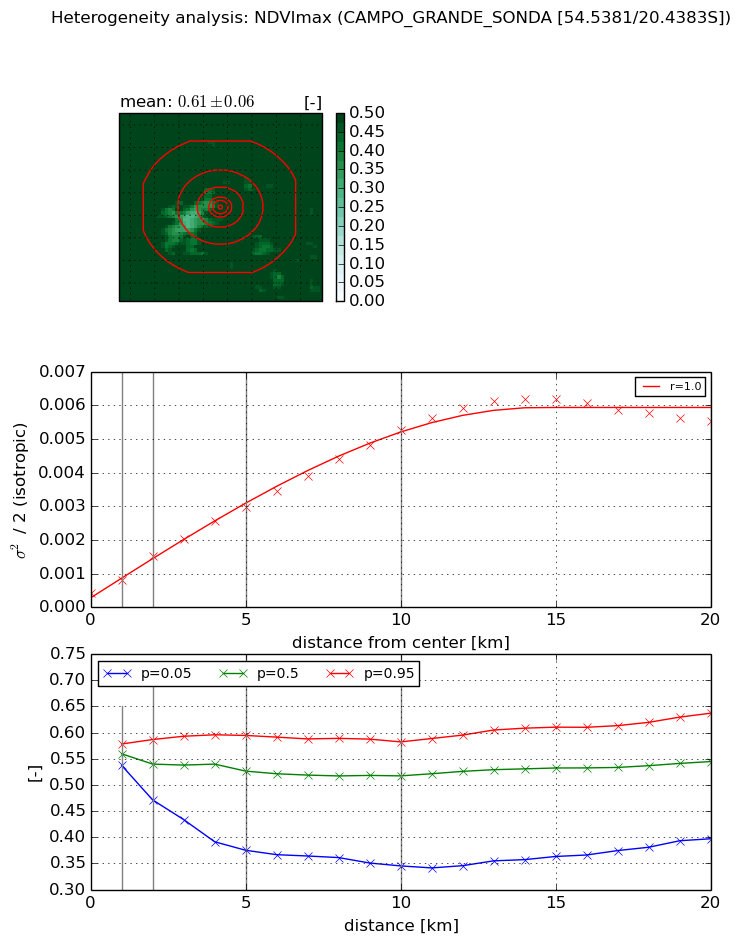
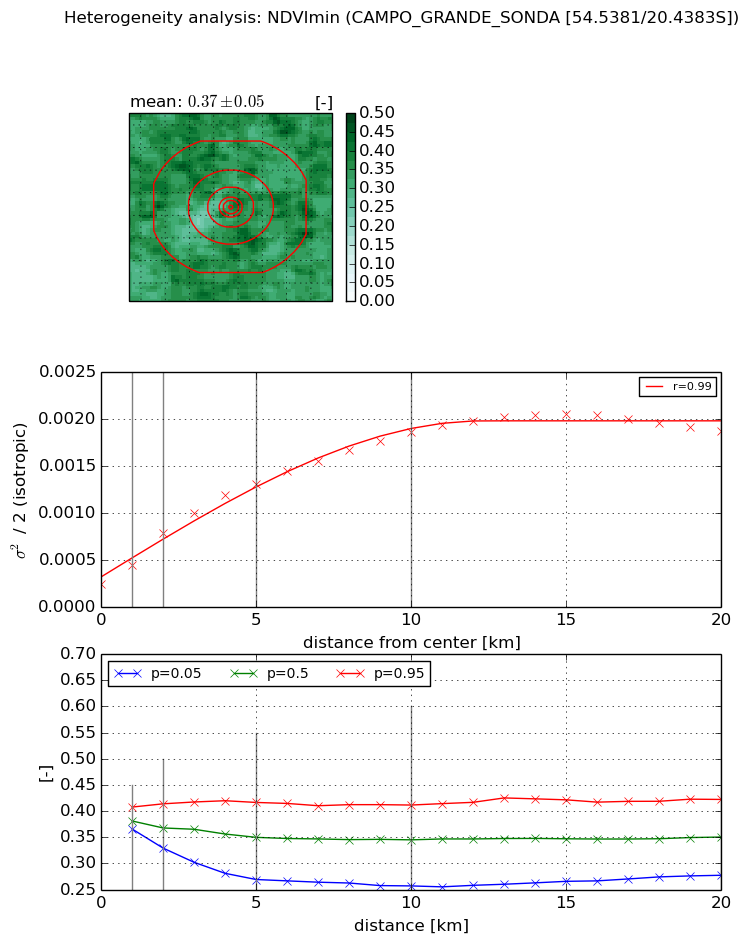
Heterogeneity analysis

The heterogeneity analysis provides information about the spatial and temporal heterogeneity of the site.

Topography


Roman et al. (2009) index


St

8.19760250642

Rcv

0.259702984262

Rse

0.0

Rst

0.0163934715791

Rsv

0.0898642012719


Height range @ 1km [m]

35

Height range @ 2km [m]

54

Height range @ 5km [m]

83

Height range @ 10km [m]

-999

Height range @ 20km [m]

-999


Variance slope @ 1 km

243

Variance slope @ 2 km

273

Variance slope @ 5 km

191

Variance slope @ 10 km

-999

Variance slope @ 20 km

-999


NDVI (max. NDVI composite)


Roman et al. (2009) index


St

2.01597350208

Rcv

0.349443993245

Rse

0.0

Rst

-0.303850324342

Rsv

0.834820480006


NDVI range @ 1km [-]

0.04

NDVI range @ 2km [-]

0.12

NDVI range @ 5km [-]

0.22

NDVI range @ 10km [-]

0.24

NDVI range @ 20km [-]

0.24


Variance slope @ 1 km

0.000376930345917

Variance slope @ 2 km

0.000546832758494

Variance slope @ 5 km

0.000532974514719

Variance slope @ 10 km

0.00048763405111

Variance slope @ 20 km

0.000277871409542


NDVI (min. NDVI composite)I


Roman et al. (2009) index


St

5.44540137789

Rcv

0.161815448584

Rse

0.0

Rst

-0.107260370568

Rsv

0.281847756874


NDVI range @ 1km [-]

0.04

NDVI range @ 2km [-]

0.08

NDVI range @ 5km [-]

0.15

NDVI range @ 10km [-]

0.15

NDVI range @ 20km [-]

0.15


NDVI slope @ 1 km

0.00020133579076

NDVI slope @ 2 km

0.000271418702631

NDVI slope @ 5 km

0.000220986944084

NDVI slope @ 10 km

0.000157751302491

NDVI slope @ 20 km

7.6967344702e-05


Temporal stability analysis

+000 deg (BHR)


BHR statistics

Temporal stability [1/decade]:


abs

rel


Weighted least square:

-99999.0


Ordinary least square:

-99999.0


Probabilities that GCOS criteria is met:

Weighted least square:

-99999.0 %

Ordinary least square:

-99999.0 %


DHR statistics

Temporal stability [1/decade]:


abs

rel


Weighted least square:

-99999.0


Ordinary least square:

-99999.0


Probabilities that GCOS criteria is met:

Weighted least square:

-99999.0 %

Ordinary least square:

-99999.0 %


+057/+063 deg (BHR)


BHR statistics

Temporal stability [1/decade]:


abs

rel


Weighted least square:

None


Ordinary least square:

None


Probabilities that GCOS criteria is met:

Weighted least square:

None %

Ordinary least square:

None %


DHR statistics

Temporal stability [1/decade]:


abs

rel


Weighted least square:

None


Ordinary least square:

None


Probabilities that GCOS criteria is met:

Weighted least square:

None %

Ordinary least square:

None %


Temporal anomaly analyis

The variance of the temporal anomalies provides an additional measure about the stability of the signal AFTER removal of the mean seasonal cylce.

+000 deg


+057/+063 deg