CARTEL


Location

lon / lat [deg]: -71.9313 / 45.3793

Source network: AERONET


Geostationary surface albedo (GSA) data


“+000”


“+057/+063”


Landcover information (based on ESA CCI landcover data)


Landcover fractions @ 2km distance


Landcover fractions @ 20 km distance


Legend


Distance to open water bodies [km]:

1.65

Distance to urban areas [km]:

0.05


Radius: 1 km

Number of landcover classes:

4

Dominant landcover type:

190: urban areas

Fraction of dominant landcover type [%]:

75.0


Radius: 2 km

Number of landcover classes:

6

Dominant landcover type:

190: urban areas

Fraction of dominant landcover type [%]:

57.0


Radius: 5 km

Number of landcover classes:

6

Dominant landcover type:

190: urban areas

Fraction of dominant landcover type [%]:

51.0


Radius: 10 km

Number of landcover classes:

8

Dominant landcover type:

62: Tree cover, broadleaved, decidous (open 15-40%)

Fraction of dominant landcover type [%]:

40.0


Radius: 20 km

Number of landcover classes:

11

Dominant landcover type:

62: Tree cover, broadleaved, decidous (open 15-40%)

Fraction of dominant landcover type [%]:

36.0


Disturbances


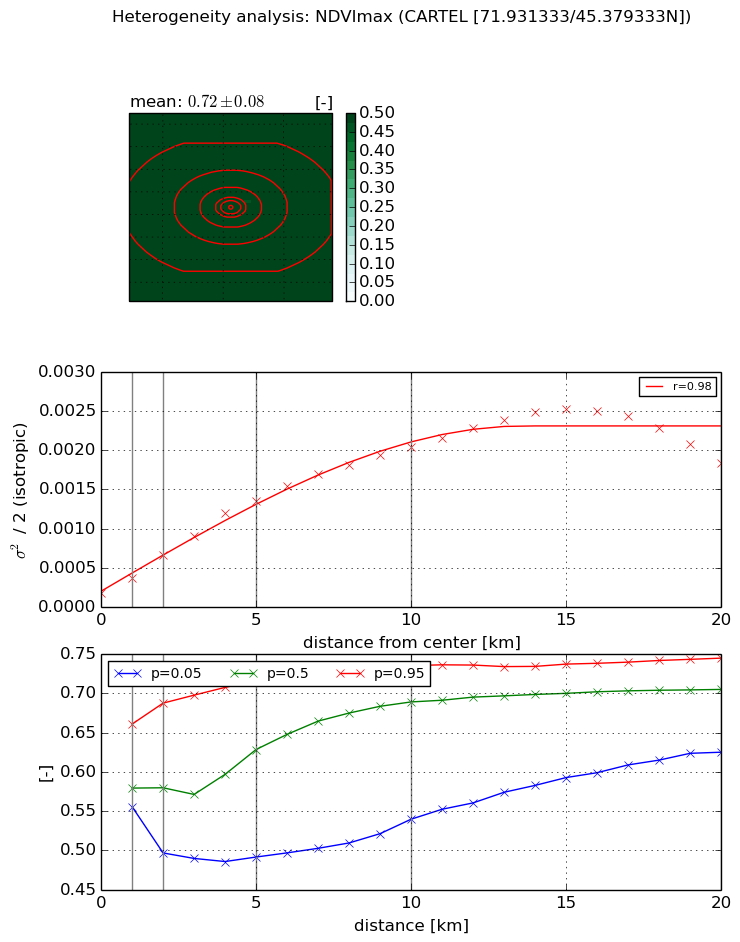
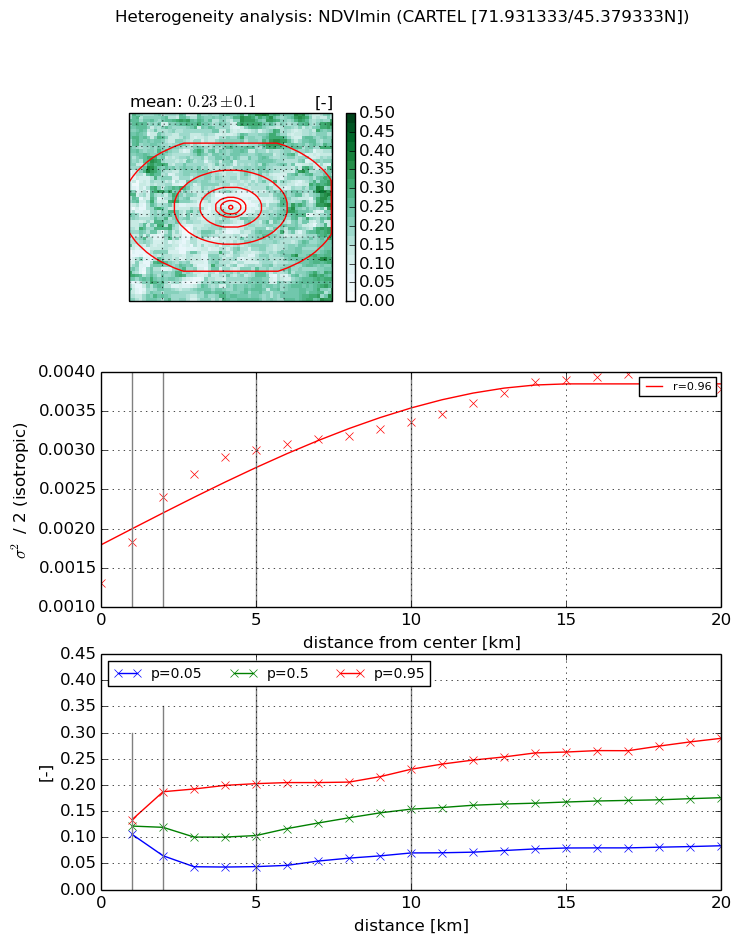
Heterogeneity analysis

The heterogeneity analysis provides information about the spatial and temporal heterogeneity of the site.

Topography


Roman et al. (2009) index


St

7.63494124522

Rcv

0.0948203606037

Rse

0.0

Rst

-0.0737640115289

Rsv

0.224345960092


Height range @ 1km [m]

98

Height range @ 2km [m]

146

Height range @ 5km [m]

175

Height range @ 10km [m]

-999

Height range @ 20km [m]

-999


Variance slope @ 1 km

599

Variance slope @ 2 km

694

Variance slope @ 5 km

658

Variance slope @ 10 km

-999

Variance slope @ 20 km

-999


NDVI (max. NDVI composite)


Roman et al. (2009) index


St

9.80361304243

Rcv

-0.0557188485414

Rse

0.0

Rst

0.134791586766

Rsv

-0.115499194715


NDVI range @ 1km [-]

0.11

NDVI range @ 2km [-]

0.19

NDVI range @ 5km [-]

0.22

NDVI range @ 10km [-]

0.2

NDVI range @ 20km [-]

0.12


Variance slope @ 1 km

0.000190826338887

Variance slope @ 2 km

0.000243043820404

Variance slope @ 5 km

0.000245973559892

Variance slope @ 10 km

0.000190371518559

Variance slope @ 20 km

9.91418669286e-05


NDVI (min. NDVI composite)I


Roman et al. (2009) index


St

4.76269811844

Rcv

0.0291294986524

Rse

0.0

Rst

-0.147272049823

Rsv

0.45349350794


NDVI range @ 1km [-]

0.03

NDVI range @ 2km [-]

0.12

NDVI range @ 5km [-]

0.16

NDVI range @ 10km [-]

0.16

NDVI range @ 20km [-]

0.21


NDVI slope @ 1 km

0.000524869019456

NDVI slope @ 2 km

0.000549502074303

NDVI slope @ 5 km

0.000344531016103

NDVI slope @ 10 km

0.000176218222463

NDVI slope @ 20 km

0.000103825230301


Temporal stability analysis

+000 deg (BHR)


BHR statistics

Temporal stability [1/decade]:


abs

rel


Weighted least square:

-99999.0


Ordinary least square:

-99999.0


Probabilities that GCOS criteria is met:

Weighted least square:

-99999.0 %

Ordinary least square:

-99999.0 %


DHR statistics

Temporal stability [1/decade]:


abs

rel


Weighted least square:

-99999.0


Ordinary least square:

-99999.0


Probabilities that GCOS criteria is met:

Weighted least square:

-99999.0 %

Ordinary least square:

-99999.0 %


+057/+063 deg (BHR)


BHR statistics

Temporal stability [1/decade]:


abs

rel


Weighted least square:

None


Ordinary least square:

None


Probabilities that GCOS criteria is met:

Weighted least square:

None %

Ordinary least square:

None %


DHR statistics

Temporal stability [1/decade]:


abs

rel


Weighted least square:

None


Ordinary least square:

None


Probabilities that GCOS criteria is met:

Weighted least square:

None %

Ordinary least square:

None %


Temporal anomaly analyis

The variance of the temporal anomalies provides an additional measure about the stability of the signal AFTER removal of the mean seasonal cylce.

+000 deg


+057/+063 deg