CAR


Location

lon / lat [deg]: 5.059 / 44.083

Source network: BSRN


Geostationary surface albedo (GSA) data


“+000”


“+057/+063”


Landcover information (based on ESA CCI landcover data)


Landcover fractions @ 2km distance


Landcover fractions @ 20 km distance


Legend


Distance to open water bodies [km]:

18.42

Distance to urban areas [km]:

0.3


Radius: 1 km

Number of landcover classes:

3

Dominant landcover type:

10: cropland, rainfed

Fraction of dominant landcover type [%]:

53.0


Radius: 2 km

Number of landcover classes:

3

Dominant landcover type:

10: cropland, rainfed

Fraction of dominant landcover type [%]:

46.0


Radius: 5 km

Number of landcover classes:

3

Dominant landcover type:

10: cropland, rainfed

Fraction of dominant landcover type [%]:

38.0


Radius: 10 km

Number of landcover classes:

4

Dominant landcover type:

10: cropland, rainfed

Fraction of dominant landcover type [%]:

43.0


Radius: 20 km

Number of landcover classes:

8

Dominant landcover type:

10: cropland, rainfed

Fraction of dominant landcover type [%]:

36.0


Disturbances


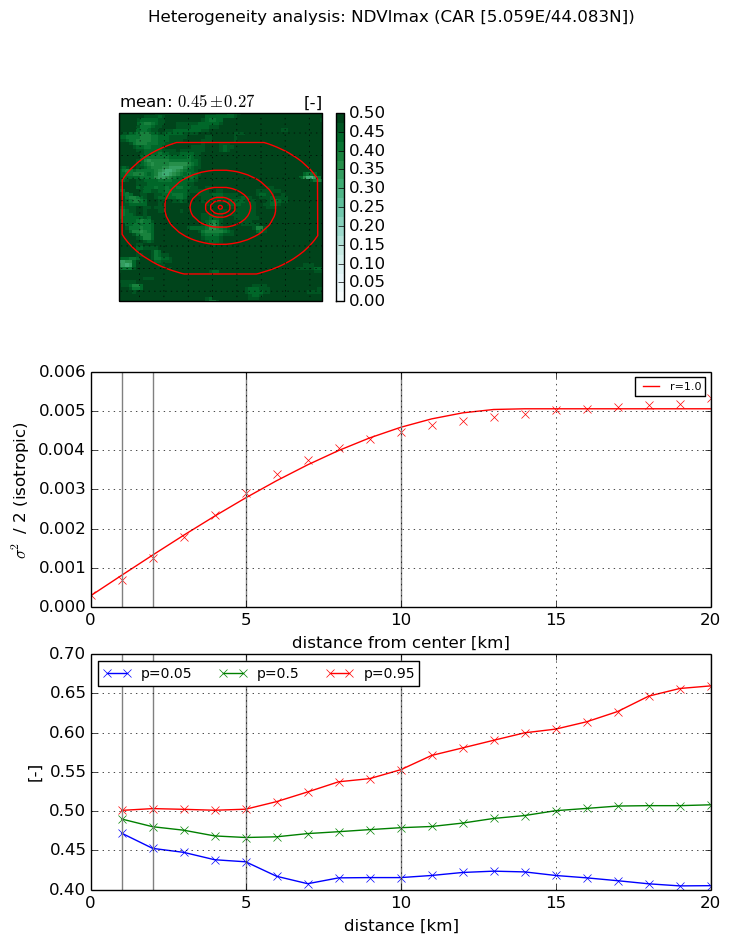
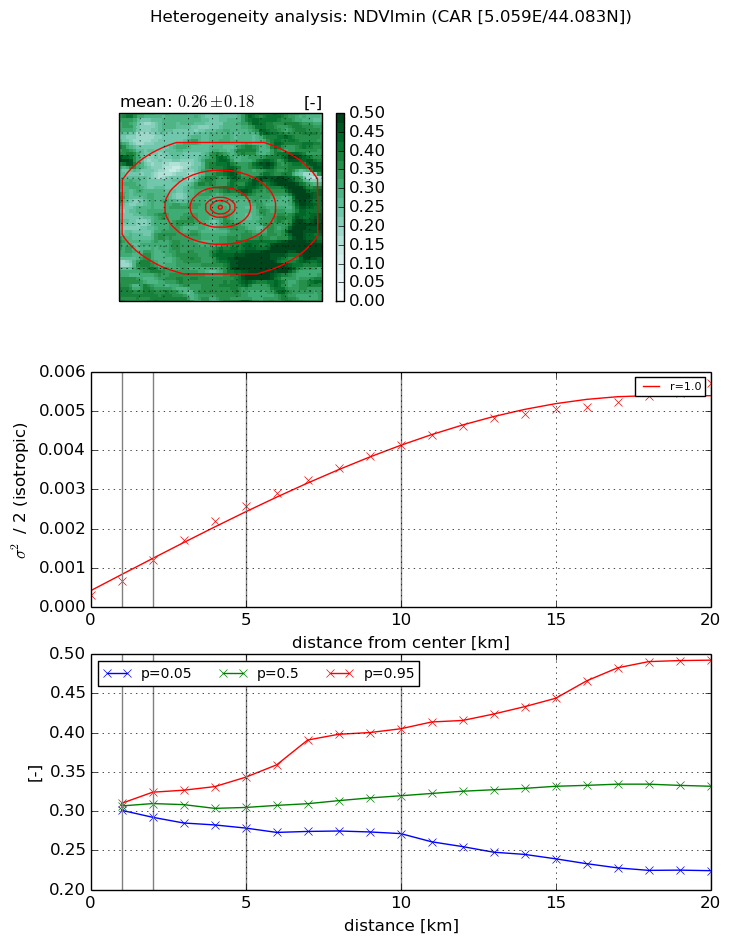
Heterogeneity analysis

The heterogeneity analysis provides information about the spatial and temporal heterogeneity of the site.

Topography


Roman et al. (2009) index


St

1.22125450066e-11

Rcv

0.633661342424

Rse

0.0

Rst

2.82762711845e-06

Rsv

2.45649043534e+11


Height range @ 1km [m]

23

Height range @ 2km [m]

42

Height range @ 5km [m]

118

Height range @ 10km [m]

-999

Height range @ 20km [m]

-999


Variance slope @ 1 km

346

Variance slope @ 2 km

333

Variance slope @ 5 km

387

Variance slope @ 10 km

-999

Variance slope @ 20 km

-999


NDVI (max. NDVI composite)


Roman et al. (2009) index


St

2.63599687304

Rcv

0.329920724362

Rse

0.0

Rst

-0.0787147710194

Rsv

0.729453866818


NDVI range @ 1km [-]

0.03

NDVI range @ 2km [-]

0.05

NDVI range @ 5km [-]

0.07

NDVI range @ 10km [-]

0.14

NDVI range @ 20km [-]

0.25


Variance slope @ 1 km

0.000371148771063

Variance slope @ 2 km

0.000464633880778

Variance slope @ 5 km

0.00052778905862

Variance slope @ 10 km

0.00044127311365

Variance slope @ 20 km

0.000237645725254


NDVI (min. NDVI composite)I


Roman et al. (2009) index


St

2.70923781784

Rcv

0.46166106442

Rse

0.0

Rst

-0.301209976643

Rsv

0.34445146132


NDVI range @ 1km [-]

0.01

NDVI range @ 2km [-]

0.03

NDVI range @ 5km [-]

0.06

NDVI range @ 10km [-]

0.13

NDVI range @ 20km [-]

0.27


NDVI slope @ 1 km

0.000360855801004

NDVI slope @ 2 km

0.000451005681511

NDVI slope @ 5 km

0.000470060063053

NDVI slope @ 10 km

0.000388207936618

NDVI slope @ 20 km

0.000260851227826


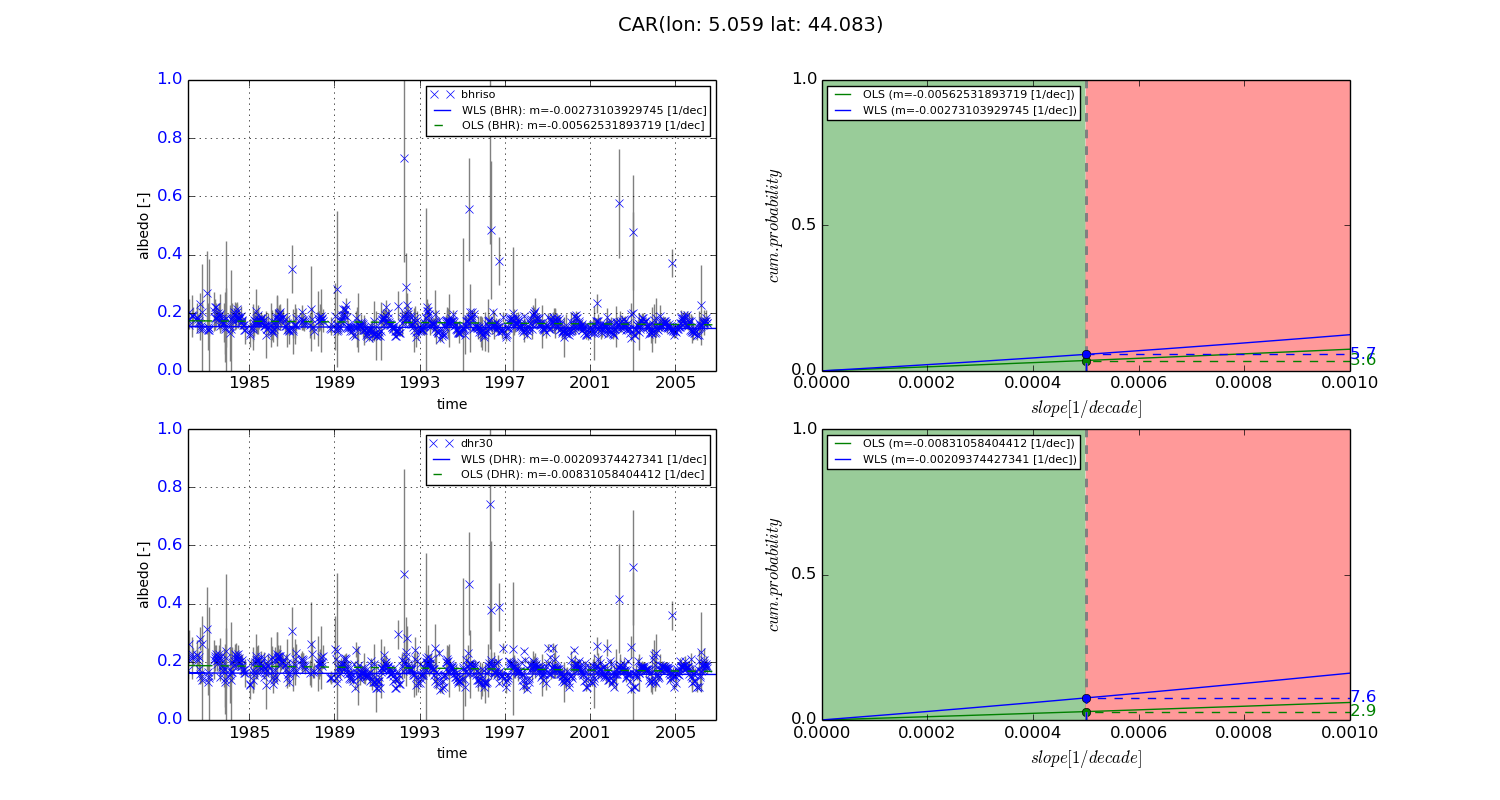
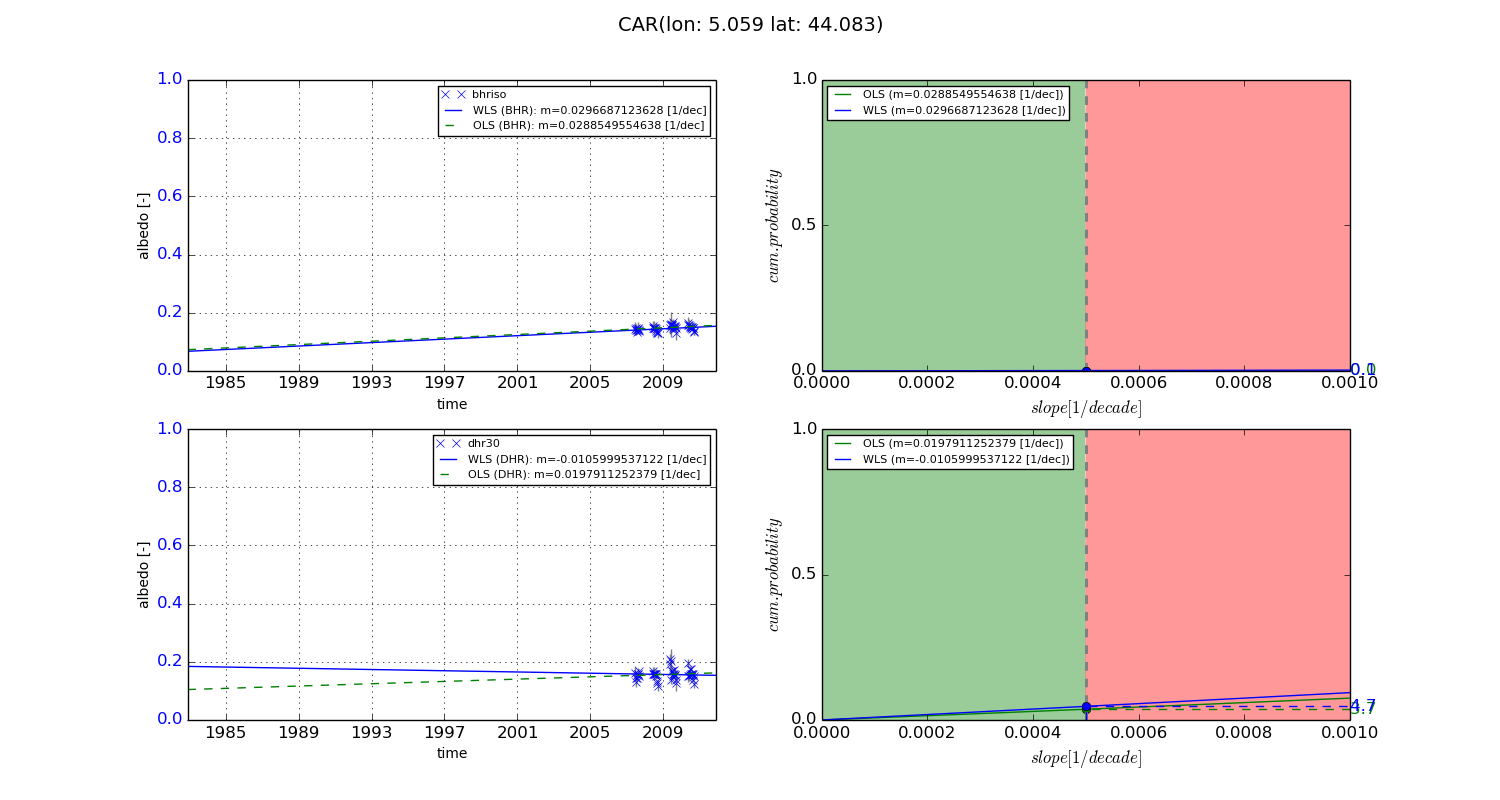
Temporal stability analysis

+000 deg (BHR)


BHR statistics

Temporal stability [1/decade]:


abs

rel


Weighted least square:

-0.00273103929745


Ordinary least square:

-0.00562531893719


Probabilities that GCOS criteria is met:

Weighted least square:

5.7 %

Ordinary least square:

3.6 %


DHR statistics

Temporal stability [1/decade]:


abs

rel


Weighted least square:

-0.00209374427341


Ordinary least square:

-0.00831058404412


Probabilities that GCOS criteria is met:

Weighted least square:

7.6 %

Ordinary least square:

2.9 %


+057/+063 deg (BHR)


BHR statistics

Temporal stability [1/decade]:


abs

rel


Weighted least square:

0.0296687123628


Ordinary least square:

0.0288549554638


Probabilities that GCOS criteria is met:

Weighted least square:

0.1 %

Ordinary least square:

0.0 %


DHR statistics

Temporal stability [1/decade]:


abs

rel


Weighted least square:

-0.0105999537122


Ordinary least square:

0.0197911252379


Probabilities that GCOS criteria is met:

Weighted least square:

4.7 %

Ordinary least square:

3.7 %


Temporal anomaly analyis

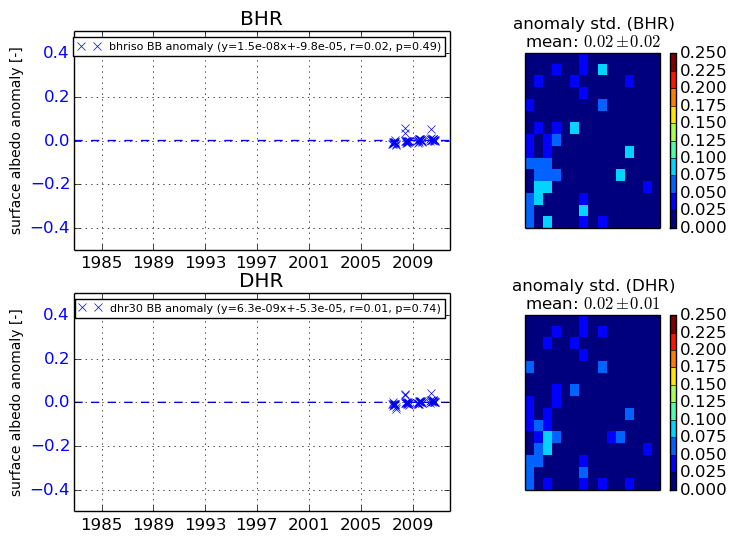
The variance of the temporal anomalies provides an additional measure about the stability of the signal AFTER removal of the mean seasonal cylce.
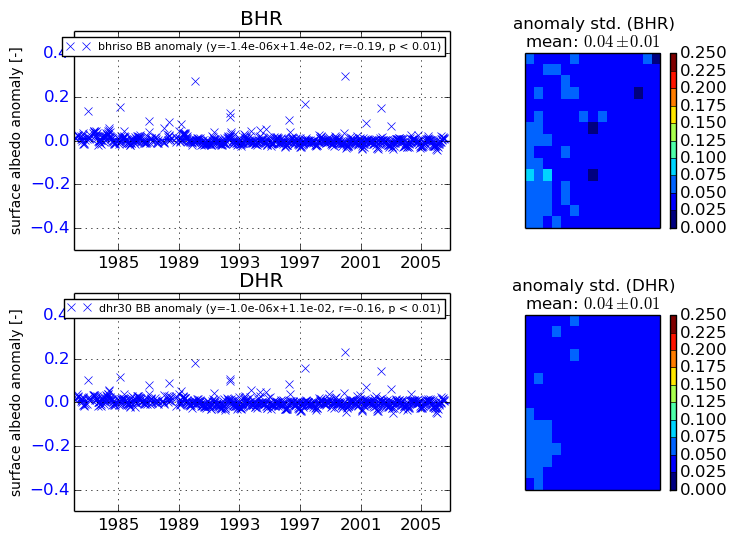
+000 deg


+057/+063 deg