CHANGCHUN


Location

lon / lat [deg]: 125.3957 / 44.0001

Source network: AERONET


Geostationary surface albedo (GSA) data


“+000”


“+057/+063”


Landcover information (based on ESA CCI landcover data)


Landcover fractions @ 2km distance


Landcover fractions @ 20 km distance


Legend


Distance to open water bodies [km]:

1.36

Distance to urban areas [km]:

1.94


Radius: 1 km

Number of landcover classes:

4

Dominant landcover type:

10: cropland, rainfed

Fraction of dominant landcover type [%]:

86.0


Radius: 2 km

Number of landcover classes:

5

Dominant landcover type:

10: cropland, rainfed

Fraction of dominant landcover type [%]:

73.0


Radius: 5 km

Number of landcover classes:

5

Dominant landcover type:

10: cropland, rainfed

Fraction of dominant landcover type [%]:

63.0


Radius: 10 km

Number of landcover classes:

5

Dominant landcover type:

10: cropland, rainfed

Fraction of dominant landcover type [%]:

51.0


Radius: 20 km

Number of landcover classes:

8

Dominant landcover type:

10: cropland, rainfed

Fraction of dominant landcover type [%]:

58.0


Disturbances


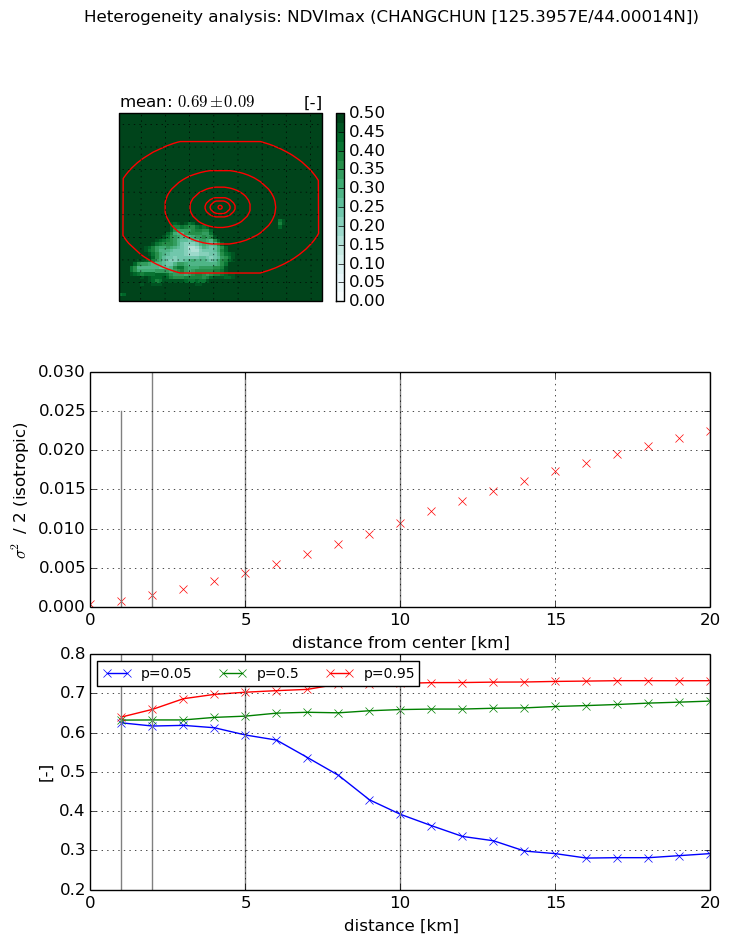
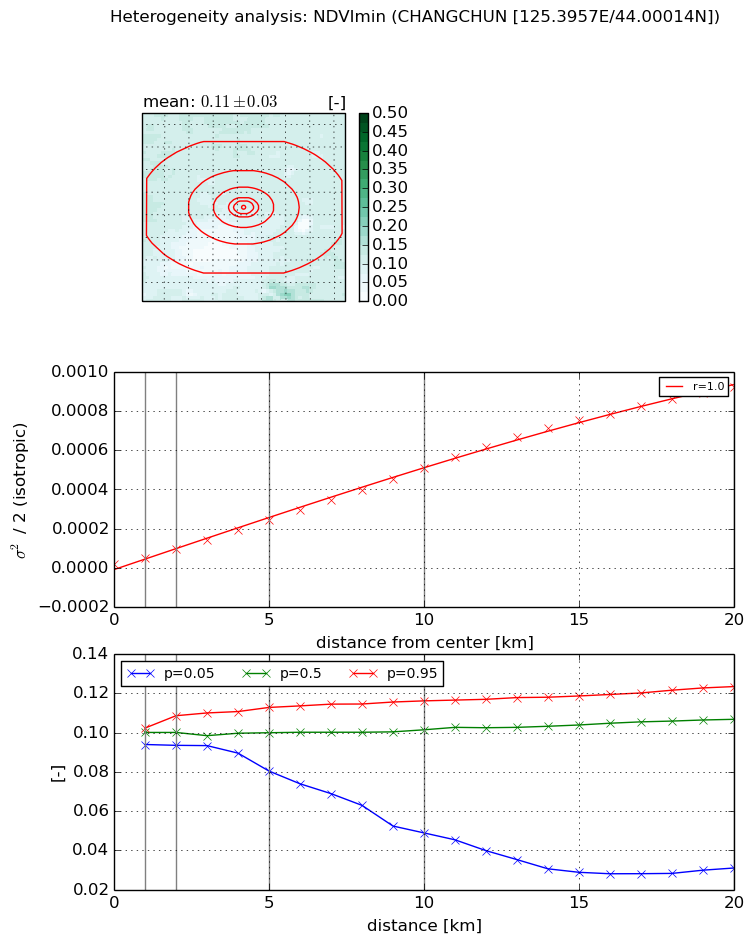
Heterogeneity analysis

The heterogeneity analysis provides information about the spatial and temporal heterogeneity of the site.

Topography


Roman et al. (2009) index


St

2.83643712175

Rcv

0.0644627717246

Rse

0.0

Rst

-1.1489901537e-06

Rsv

-0.993200984669


Height range @ 1km [m]

12

Height range @ 2km [m]

29

Height range @ 5km [m]

39

Height range @ 10km [m]

-999

Height range @ 20km [m]

-999


Variance slope @ 1 km

32

Variance slope @ 2 km

35

Variance slope @ 5 km

42

Variance slope @ 10 km

-999

Variance slope @ 20 km

-999


NDVI (max. NDVI composite)


Roman et al. (2009) index


St

4.54833327778

Rcv

0.50369208245

Rse

0.0

Rst

-6.01668616898e-09

Rsv

0.155890184156


NDVI range @ 1km [-]

0.01

NDVI range @ 2km [-]

0.04

NDVI range @ 5km [-]

0.11

NDVI range @ 10km [-]

0.33

NDVI range @ 20km [-]

0.44


Variance slope @ 1 km

0.000471702063444

Variance slope @ 2 km

0.000608979083034

Variance slope @ 5 km

0.000807294046327

Variance slope @ 10 km

0.00105930938761

Variance slope @ 20 km

0.00118784789297


NDVI (min. NDVI composite)I


Roman et al. (2009) index


St

3.68635812425

Rcv

0.729303273535

Rse

0.0

Rst

-8.5766340954e-09

Rsv

-0.0845080457313


NDVI range @ 1km [-]

0.01

NDVI range @ 2km [-]

0.02

NDVI range @ 5km [-]

0.03

NDVI range @ 10km [-]

0.07

NDVI range @ 20km [-]

0.09


NDVI slope @ 1 km

2.99020083135e-05

NDVI slope @ 2 km

3.79840297754e-05

NDVI slope @ 5 km

4.48976306028e-05

NDVI slope @ 10 km

4.94260126429e-05

NDVI slope @ 20 km

4.77356910872e-05


Temporal stability analysis

+000 deg (BHR)


BHR statistics

Temporal stability [1/decade]:


abs

rel


Weighted least square:

None


Ordinary least square:

None


Probabilities that GCOS criteria is met:

Weighted least square:

None %

Ordinary least square:

None %


DHR statistics

Temporal stability [1/decade]:


abs

rel


Weighted least square:

None


Ordinary least square:

None


Probabilities that GCOS criteria is met:

Weighted least square:

None %

Ordinary least square:

None %


+057/+063 deg (BHR)


BHR statistics

Temporal stability [1/decade]:


abs

rel


Weighted least square:

-99999.0


Ordinary least square:

-99999.0


Probabilities that GCOS criteria is met:

Weighted least square:

-99999.0 %

Ordinary least square:

-99999.0 %


DHR statistics

Temporal stability [1/decade]:


abs

rel


Weighted least square:

-99999.0


Ordinary least square:

-99999.0


Probabilities that GCOS criteria is met:

Weighted least square:

-99999.0 %

Ordinary least square:

-99999.0 %


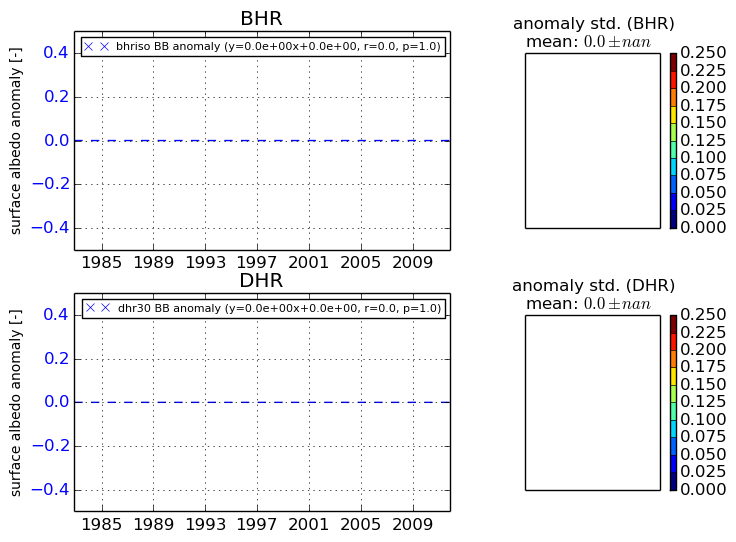
Temporal anomaly analyis

The variance of the temporal anomalies provides an additional measure about the stability of the signal AFTER removal of the mean seasonal cylce.

+000 deg


+057/+063 deg